Additional Reading Materials
Chapter 3: Electron Configurations and the Periodic Table
We can use our understanding of quantum numbers to determine how atomic orbitals relate to one another. This allows us to determine which orbitals are occupied by electrons in each atom. The specific arrangement of electrons in orbitals of an atom determines many of the chemical properties of that atom.
Ch3.1 Orbital Energies and Atomic Structure
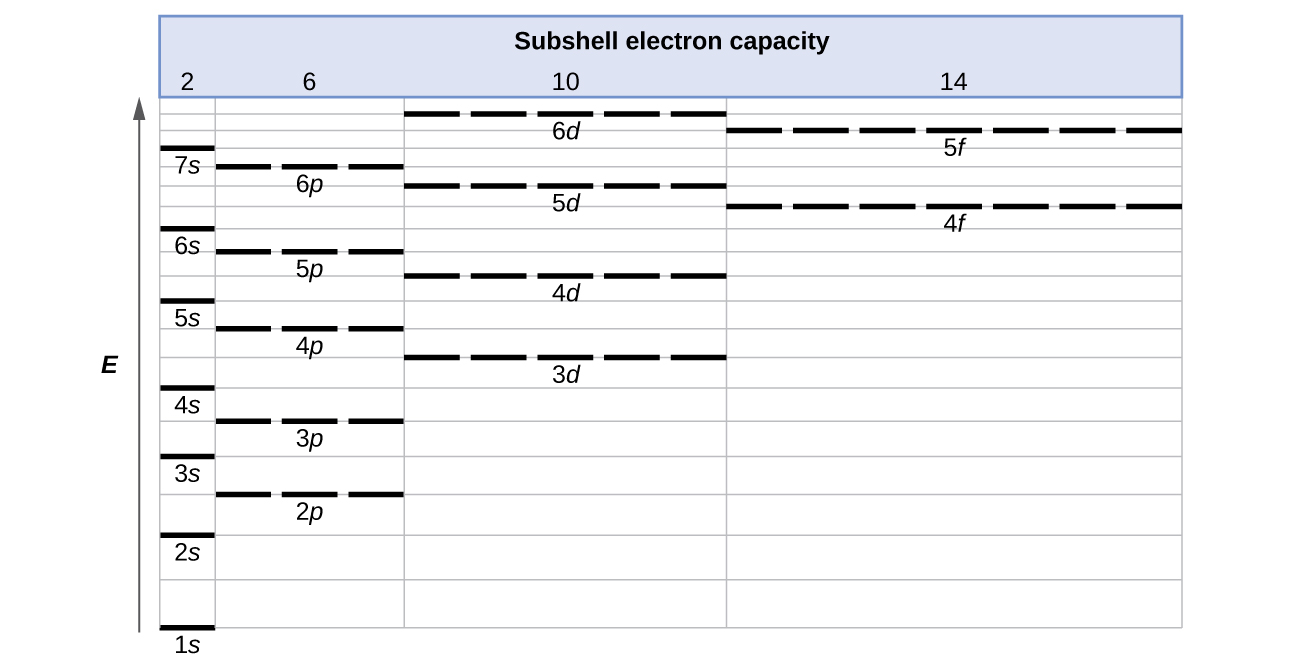
The energy of atomic orbitals increases as the principal quantum number, n, increases. In any atom with two or more electrons, the repulsion between the electrons makes energies of subshells with different values of l differ so that the energy of the orbitals increases within a shell in the order s < p < d < f. Figure 1 depicts how these two trends in increasing energy relate. The 1s orbital at the bottom of the diagram is the orbital with electrons of lowest energy. The energy increases as we move up to the 2s and then 2p, 3s, and 3p orbitals, showing that the increasing n value has more influence on energy than the increasing l value for small atoms. However, this pattern does not hold for larger atoms. The 3d orbital is higher in energy than the 4s orbital. Such overlaps continue to occur frequently as we move up the chart.
Electrons in successive atoms on the periodic table tend to fill low-energy orbitals first. Thus, many students find it confusing that, for example, the 5p orbitals fill immediately after the 4d, and immediately before the 6s. The filling order is based on observed experimental results, and has been confirmed by theoretical calculations. As the principal quantum number, n, increases, the size of the orbital increases and the electrons spend more time farther from the nucleus. Thus, the attraction to the nucleus is weaker and the energy associated with the orbital is higher (less stabilized). But this is not the only effect we have to take into account. Within each shell, as the value of l increases, the electrons are less penetrating (meaning there is less electron density found close to the nucleus), in the order s > p > d > f. Electrons that are closer to the nucleus slightly repel electrons that are farther out, offsetting the more dominant electron–nucleus attractions slightly (recall that all electrons have −1 charges, but nuclei have +Z charges). This phenomenon is called shielding and will be discussed in more detail at a later time. Electrons in orbitals that experience more shielding are less stabilized and thus higher in energy. For small orbitals (1s through 3p), the increase in energy due to n is more significant than the increase due to l; however, for larger orbitals the two trends are comparable and cannot be simply predicted. We will discuss methods for remembering the observed order.
The arrangement of electrons in the orbitals of an atom is called the electron configuration of the atom. We describe an electron configuration with a symbol that contains three pieces of information (Figure 2):
- The number of the principal quantum shell, n,
- The letter that designates the orbital type (the subshell, l), and
- A superscript number that designates the number of electrons in that particular subshell.
For example, the notation 2p4 (read "two–p–four") indicates four electrons in a p subshell (l = 1) with a principal quantum number (n) of 2. The notation 3d8 (read "three–d–eight") indicates eight electrons in the d subshell (i.e., l = 2) of the principal shell for which n = 3.

Ch3.2 Aufbau Principle and Hund's Rule
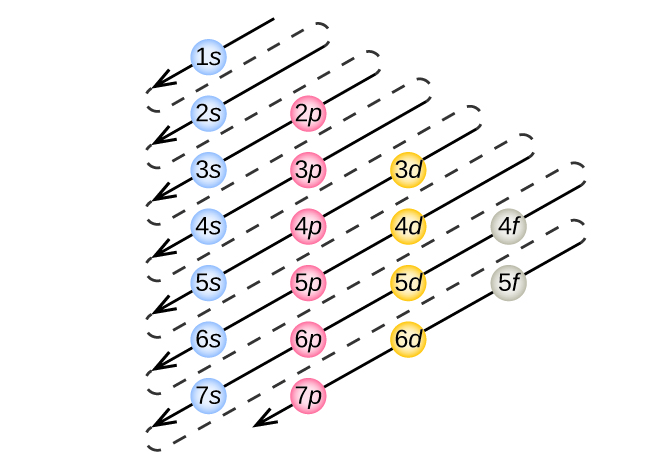
To determine the electron configuration for any particular atom, we can “build” the structures in the order of atomic numbers. Beginning with hydrogen, and continuing across the periods of the periodic table, we add one proton at a time to the nucleus and one electron to the proper subshell until we have described the electron configurations of all the elements. This procedure is called the Aufbau principle, from the German word Aufbau (“to build up”). Each added electron occupies the subshell of lowest energy available (in the order shown in Figure 1), subject to the limitations imposed by the allowed quantum numbers according to the Pauli exclusion principle. Electrons enter higher-energy subshells only after lower-energy subshells have been filled to capacity. Figure 3 illustrates the traditional way to remember the filling order for atomic orbitals.
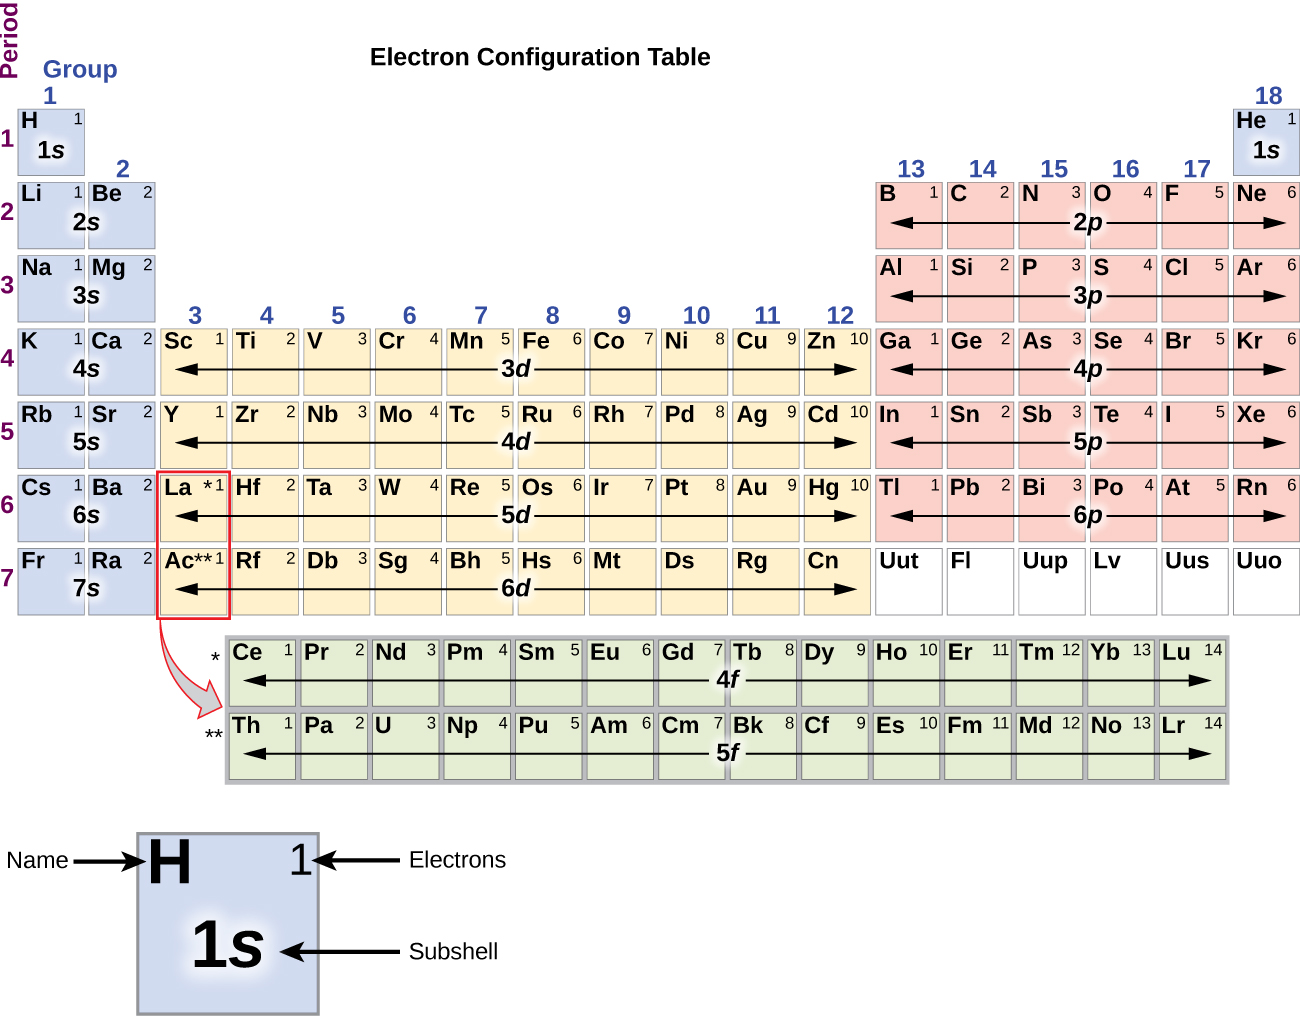
Since the arrangement of the periodic table is based on the electron configurations, Figure 4 provides an alternative method for determining the electron configuration. The filling order simply begins at hydrogen and includes each subshell as you proceed in increasing Z order. For example, after filling the 3p block up to Ar, we see the orbital will be 4s (K, Ca), followed by the 3d orbitals.
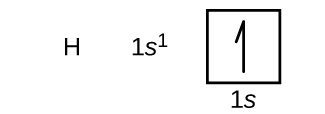
We will now construct the ground-state electron configuration and orbital diagram for a selection of atoms in the first and second periods of the periodic table. Orbital diagrams are pictorial representations of the electron configuration, showing the individual orbitals and the pairing arrangement of electrons. We start with a single hydrogen atom (atomic number 1), which consists of one proton and one electron. Referring to Figure 3 or Figure 4, we would expect to find the electron in the 1s orbital. By convention, the [latex]m_s = + \frac{1}{2}[/latex] value is usually filled first. The electron configuration and the orbital diagram are:
Following hydrogen is the noble gas helium, which has an atomic number of 2. The helium atom contains two protons and two electrons. The first electron has the same four quantum numbers as the hydrogen atom electron (n = 1, l = 0, ml = 0, [latex]m_s = + \frac{1}{2}[/latex]). The second electron also goes into the 1s orbital and fills that orbital. The second electron has the same n, l, and ml quantum numbers, but must have the opposite spin quantum number, [latex]m_s = - \frac{1}{2}[/latex]. This is in accord with the Pauli exclusion principle: No two electrons in the same atom can have the same set of four quantum numbers. For orbital diagrams, this means two arrows go in each box (representing two electrons in each orbital) and the arrows must point in opposite directions (representing paired spins).
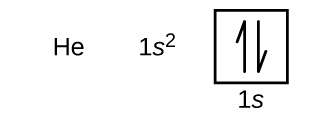
The n = 1 shell is completely filled in the ground state of a helium atom.
The next atom is the alkali metal lithium with an atomic number of 3. The first two electrons in lithium fill the 1s orbital and have the same sets of four quantum numbers as the two electrons in helium. The remaining electron must occupy the orbital of next lowest energy, the 2s orbital.

An atom of the alkaline earth metal beryllium, with an atomic number of 4, contains four protons in the nucleus and four electrons surrounding the nucleus. The fourth electron fills the remaining space in the 2s orbital.

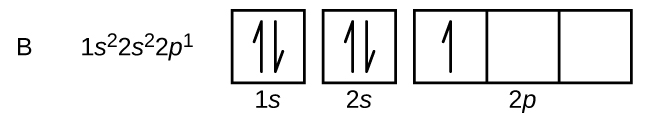
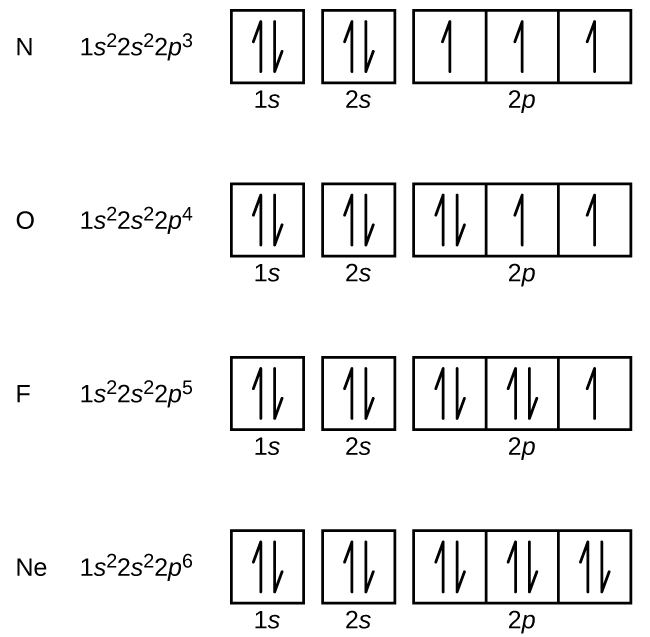
An atom of boron (atomic number 5) contains five electrons. The n = 1 shell is filled with two electrons and three electrons will occupy the n = 2 shell. Because any s subshell can contain only two electrons, the fifth electron must occupy the next energy level, which will be a 2p orbital. There are three degenerate 2p orbitals (ml = −1, 0, +1) and the electron can occupy any one of these p orbitals. When drawing orbital diagrams, we include empty boxes to depict any empty orbitals in the same subshell that we are filling.
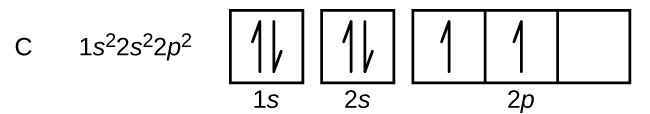
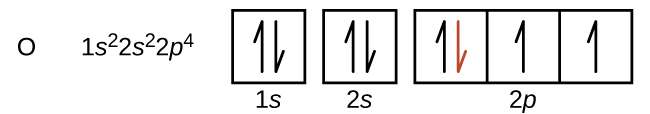
Carbon (atomic number 6) has six electrons. Four of them fill the 1s and 2s orbitals. The remaining two electrons occupy the 2p subshell. We now have a choice of filling one of the 2p orbitals and pairing the electrons or of leaving the electrons unpaired in two different, but degenerate, p orbitals. The orbitals are filled as described by Hund’s rule: the lowest-energy configuration for an atom with electrons within a set of degenerate orbitals is achieved by having the maximum number of unpaired electrons. Thus, the two electrons in the carbon 2p orbitals have identical n, l, and ms quantum numbers and differ in their ml quantum number (in accord with the Pauli exclusion principle). The electron configuration and orbital diagram for the ground state of carbon are:
Nitrogen (atomic number 7) fills the 1s and 2s subshells and has one electron in each of the three 2p orbitals, in accordance with Hund’s rule. These three electrons have unpaired spins. Oxygen (atomic number 8) has a pair of electrons in any one of the 2p orbitals (the electrons have opposite spins) and a single electron in each of the other two. Fluorine (atomic number 9) has only one 2p orbital containing an unpaired electron. All of the electrons in the noble gas neon (atomic number 10) are paired, and all of the orbitals in the n = 1 and the n = 2 shells are filled.
The alkali metal sodium (atomic number 11) has one more electron than the neon atom. This electron must go into the lowest-energy subshell available, the 3s orbital, giving a 1s22s22p63s1 configuration. The electrons occupying the outermost shell orbital(s) (highest value of n) are called valence electrons, and those occupying the inner shell orbitals are called core electrons (Figure 5). Since the core electron shells correspond to noble gas electron configurations, we can abbreviate electron configurations by writing the noble gas that matches the core electron configuration, along with the valence electrons in a condensed format. For sodium, the symbol [Ne] represents core electrons, (1s22s22p6) and the abbreviated or condensed configuration is [Ne]3s1.
![This figure includes the element symbol N a, followed by the electron configuration for the element. The first part of the electron configuration, 1 s superscript 2 2 s superscript 2 2 p superscript 6, is shaded in purple and is labeled, “core electrons.” The last portion, 3 s superscript 1, is shaded orange and is labeled, “valence electron.” To the right of this configuration is the word “Abbreviation” followed by [ N e ] 3 s superscript 1.](https://opentextbc.ca/chemistry/wp-content/uploads/sites/150/2016/05/CNX_Chem_06_04_Valence.jpg)
Similarly, the abbreviated configuration of lithium can be represented as [He]2s1, where [He] represents the configuration of the helium atom, which is identical to that of the filled inner shell of lithium. Writing the configurations in this way emphasizes the similarity of the configurations of lithium and sodium. Both atoms, which are in the alkali metal family, have only one electron in a valence s subshell outside a filled set of inner shells.
Figure 6 shows the lowest energy, or ground-state, electron configuration for atoms of each of the known elements.
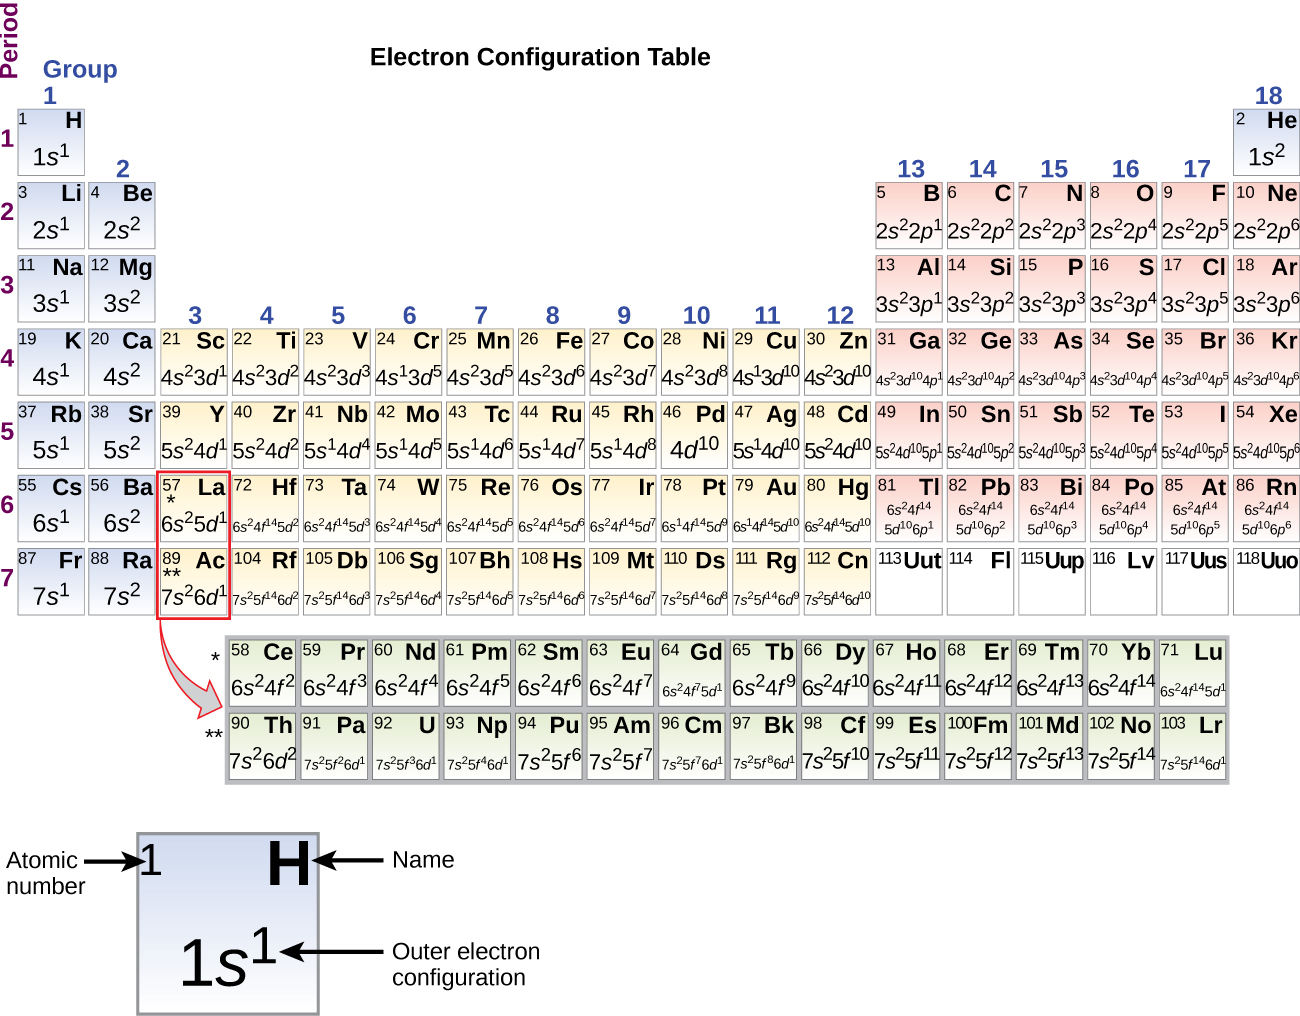
When we come to the alkali metal potassium (atomic number 19), we might expect that we would begin to add electrons to the 3d subshell. However, all available chemical and physical evidence indicates that potassium is like lithium and sodium, and that the next electron is not added to the 3d level but is, instead, added to the 4s level (Figure 6). As discussed previously, the 3d orbital with no radial nodes is higher in energy than the 4s orbital because it is less penetrating and more shielded from the nucleus. Thus, potassium has an electron configuration of [Ar]4s1, and corresponds to Li and Na in its valence shell configuration. The next electron is added to complete the 4s subshell and calcium has an electron configuration of [Ar]4s2.
Beginning with the transition metal scandium (atomic number 21), additional electrons are added successively to the 3d subshell. This subshell is filled to its capacity with 10 electrons (remember that for l = 2 [d orbitals], there are 2l + 1 = 5 values of ml, meaning that there are five d orbitals that have a combined capacity of 10 electrons). The 4p subshell fills next. Note that for three series of elements, scandium (Sc) through copper (Cu), yttrium (Y) through silver (Ag), and lutetium (Lu) through gold (Au), a total of 10 d electrons are successively added to the (n – 1) shell next to the n shell to bring that (n – 1) shell from 8 to 18 electrons. For two series, lanthanum (La) through lutetium (Lu) and actinium (Ac) through lawrencium (Lr), 14 f electrons (l = 3, 2l + 1 = 7 ml values; thus, seven orbitals with a combined capacity of 14 electrons) are successively added to the (n – 2) shell to bring that shell from 18 electrons to a total of 32 electrons.
Example 1
Quantum Numbers and Electron Configurations
What is the electron configuration and orbital diagram for a phosphorus atom? What are the four quantum numbers for the last electron added?
Solution
The atomic number of phosphorus is 15. Thus, a phosphorus atom contains 15 electrons. The order of filling of the energy levels is 1s, 2s, 2p, 3s, 3p, 4s, . . . The 15 electrons of the phosphorus atom will fill up to the 3p orbital, which will contain three electrons:
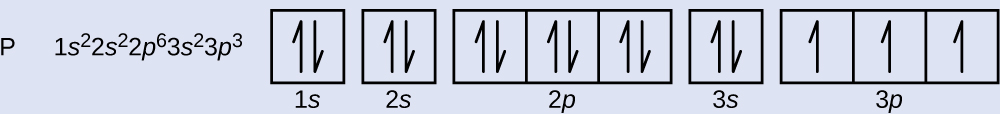
The last electron added is a 3p electron. Therefore, n = 3 and, for a p-type orbital, l = 1. The ml value could be –1, 0, or +1. The three p orbitals are degenerate, so any of these ml values is correct. For unpaired electrons, convention assigns the value of [latex]+\frac{1}{2}[/latex] for the spin quantum number; thus, [latex]m_s = +\frac{1}{2}[/latex].
Check Your Learning
Identify the atoms from the electron configurations given:
(a) [Ar]4s23d5
(b) [Kr]5s24d105p6
Answer:
(a) Mn (b) Xe
The periodic table can be a powerful tool in predicting the electron configuration of an element. However, we do find exceptions to the order of filling of orbitals that are shown in Figure 3 or Figure 4. For instance, the electron configurations (shown in Figure 6) of the transition metals chromium (Cr; atomic number 24) and copper (Cu; atomic number 29), among others, are not those we would expect. In general, such exceptions involve subshells with very similar energy, and small effects can lead to changes in the order of filling.
In the case of Cr and Cu, we find that half-filled and completely filled subshells represent conditions of preferred stability. This stability is such that an electron shifts from the 4s into the 3d orbital to gain the extra stability of a half-filled 3d subshell (in Cr) or a filled 3d subshell (in Cu).
Ch3.3 Paramagnetism
A substance's attraction to a magnetic field is called paramagnetism, and it arises due to the presence of unpaired electrons. Magnetic susceptibility measures the force experienced by a substance in a magnetic field. When we compare the weight of a sample to the weight measured in a magnetic field (Figure 7), paramagnetic samples that are attracted to the magnet will appear heavier because of the force exerted by the magnetic field. We can calculate the number of unpaired electrons based on the increase in weight.
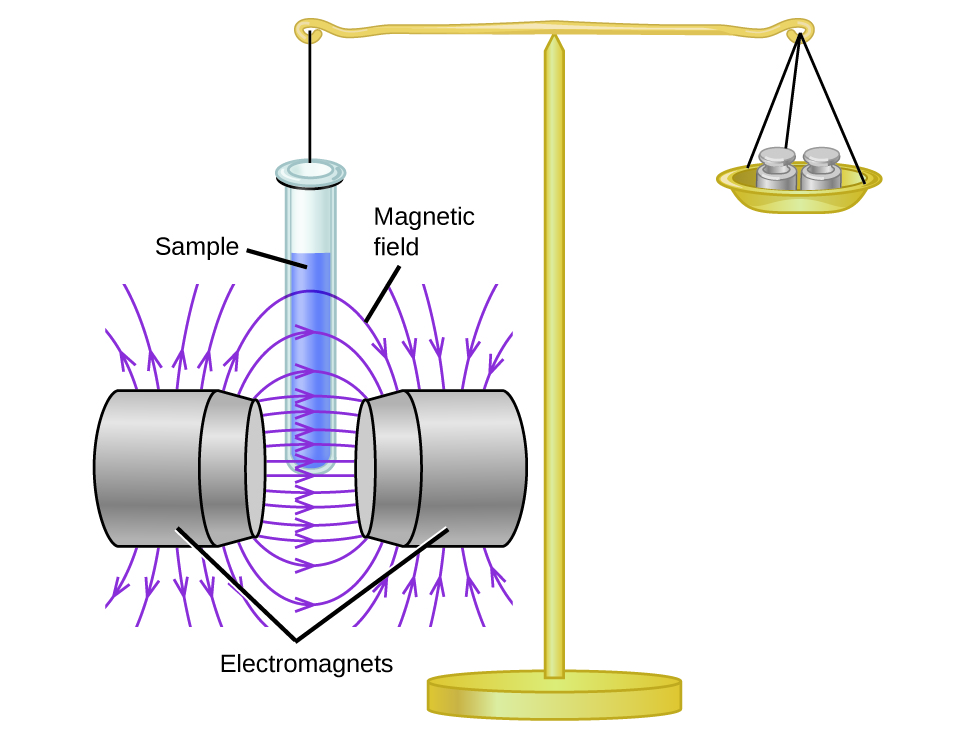
Materials in which all of the electrons are paired are diamagnetic and weakly repel a magnetic field. (The apparent weight of such substances decrease slightly in the presence of an inhomogeneous magnetic field.) Paramagnetic and diamagnetic materials do not act as permanent magnets. Only in the presence of an applied magnetic field do they demonstrate attraction or repulsion.
Water, like most molecules, contains all paired electrons. Living things contain a large percentage of water, so they demonstrate diamagnetic behavior. If you place a frog near a sufficiently large magnet, it will levitate. You can see videos of diamagnetic floating frogs, strawberries, and more.
Ch3.4 Electron Configurations and the Periodic Table
The periodic table arranges atoms based on increasing atomic number so that elements with the same chemical properties recur periodically. When their electron configurations are added to the table (Figure 6), we also see a periodic recurrence of similar electron configurations in the outer shells of these elements. Because they are in the outer shells of an atom, valence electrons play the most important role in chemical reactions. The outer electrons have the highest energy of the electrons in an atom and are more easily lost or shared than the core electrons. Valence electrons are also the determining factor in some physical properties of the elements.
Elements in any one group (or column) have the same number of valence electrons; the alkali metals lithium and sodium each have only one valence electron, the alkaline earth metals beryllium and magnesium each have two, and the halogens fluorine and chlorine each have seven valence electrons. The similarity in chemical properties among elements of the same group occurs because they have the same number of valence electrons. It is the loss, gain, or sharing of valence electrons that defines how elements react.
It is important to remember that the periodic table was developed on the basis of the chemical behavior of the elements, well before any idea of their atomic structure was available. Now we can understand why the periodic table has the arrangement it has—the arrangement puts elements whose atoms have the same number of valence electrons in the same group. This arrangement is emphasized in Figure 6, which shows in periodic-table form the electron configuration of the last subshell to be filled by the Aufbau principle. The colored sections of Figure 6 show the three categories of elements classified by the orbitals being filled: main group, transition, and inner transition elements. These classifications determine which orbitals are counted in the valence shell, or highest energy level orbitals of an atom.
- Main group elements (sometimes called representative elements) are those in which the last electron added enters an s or a p orbital in the outermost shell, shown in blue and red in Figure 6. This category includes all the nonmetallic elements, as well as many metals and the intermediate semimetallic elements. The valence electrons for main group elements are those with the highest n level. For example, gallium (Ga, atomic number 31) has the electron configuration [Ar]4s23d104p1, which contains three valence electrons (underlined). The completely filled d orbitals count as core, not valence, electrons.
- Transition elements or transition metals. These are metallic elements in which the last electron added enters a d orbital. The valence electrons (those added after the last noble gas configuration) in these elements include the ns and (n – 1) d electrons. The official IUPAC definition of transition elements specifies those with partially filled d orbitals. Thus, the elements with completely filled orbitals (Zn, Cd, Hg, as well as Cu, Ag, and Au) are not technically transition elements. However, the term is frequently used to refer to the entire d block (colored yellow in Figure 6), and we will adopt this usage here as well.
- Inner transition elements are metallic elements in which the last electron added occupies an f orbital. They are shown in green in Figure 6. The valence shells of the inner transition elements consist of the (n – 2)f, the (n – 1)d, and the ns subshells. There are two inner transition series:
- The lanthanide series: lanthanide (La) through lutetium (Lu)
- The actinide series: actinide (Ac) through lawrencium (Lr)
Lanthanum and actinium, because of their similarities to the other members of the series, are included and used to name the series, even though they are transition metals with no f electrons.
Ch3.5 Electron Configurations of Ions
Ions are formed when atoms gain or lose electrons. A cation (positively charged ion) forms when one or more electrons are removed from a parent atom. For main group elements, the electrons that were added last are the first electrons removed. For transition metals and inner transition metals, however, electrons in the s orbital are easier to remove than the d or f electrons, and so the highest ns electrons are lost, and then the (n – 1)d or (n – 2)f electrons are removed. An anion (negatively charged ion) forms when one or more electrons are added to a parent atom. The added electrons fill in the order predicted by the Aufbau principle.
Example 2
Predicting Electron Configurations of Ions
What is the electron configuration and orbital diagram of:
(a) Na+
(b) P3–
(c) Al2+
(d) Fe2+
(e) Sm3+
Solution
First, write out the electron configuration for each parent atom. We have chosen to show the full, unabbreviated configurations to provide more practice for students who want it, but listing the core-abbreviated electron configurations is also acceptable.
Next, determine whether an electron is gained or lost. Remember electrons are negatively charged, so ions with a positive charge have lost an electron. For main group elements, the last orbital gains or loses the electron. For transition metals, the ns orbital loses an electron before the (n-1)d orbitals.
(a) Na: 1s22s22p63s1. Sodium cation loses one electron, so Na+: 1s22s22p6.
(b) P: 1s22s22p63s23p3. Phosphorus trianion gains three electrons, so P3−: 1s22s22p63s23p6.
(c) Al: 1s22s22p63s23p1. Aluminum dication loses two electrons, so Al2+: 1s22s22p63s1.
(d) Fe: 1s22s22p63s23p64s23d6. Iron(II) loses two electrons and, since it is a transition metal, they are removed from the 4s orbital, so Fe2+: 1s22s22p63s23p63d6.
(e). Sm: 1s22s22p63s23p64s23d104p65s24d105p66s24f6. Samarium trication loses three electrons. The first two will be lost from the 6s orbital, and the final one is removed from the 4f orbital. Sm3+: 1s22s22p63s23p64s23d104p65s24d105p64f5.
Check Your Learning
Which ion with a +2 charge has the electron configuration 1s22s22p63s23p63d104s24p64d5? Which ion with a +3 charge has this configuration?
Answer:
Tc2+, Ru3+
Ch3.6 Periodic Trends
The elements in groups (vertical columns) of the periodic table exhibit similar chemical behavior. This similarity occurs because the members of a group have the same number and distribution of electrons in their valence shells. There are also other patterns in chemical properties on the periodic table. For example, as we move down a group, the metallic character of the atoms increases. Oxygen, at the top of group 16 (6A), is a colorless gas; in the middle of the group, selenium is a semiconducting solid; and, toward the bottom, polonium is a silver-grey solid that conducts electricity. An understanding of the electronic structure of the elements allows us to examine some of the properties that govern their chemical behavior.
Explore visualizations of the periodic trends discussed here (and many more trends). With just a few clicks, you can create three-dimensional versions of the periodic table showing atomic size or graphs of ionization energies from all measured elements.
Ch3.7 Variation in Atomic Radius
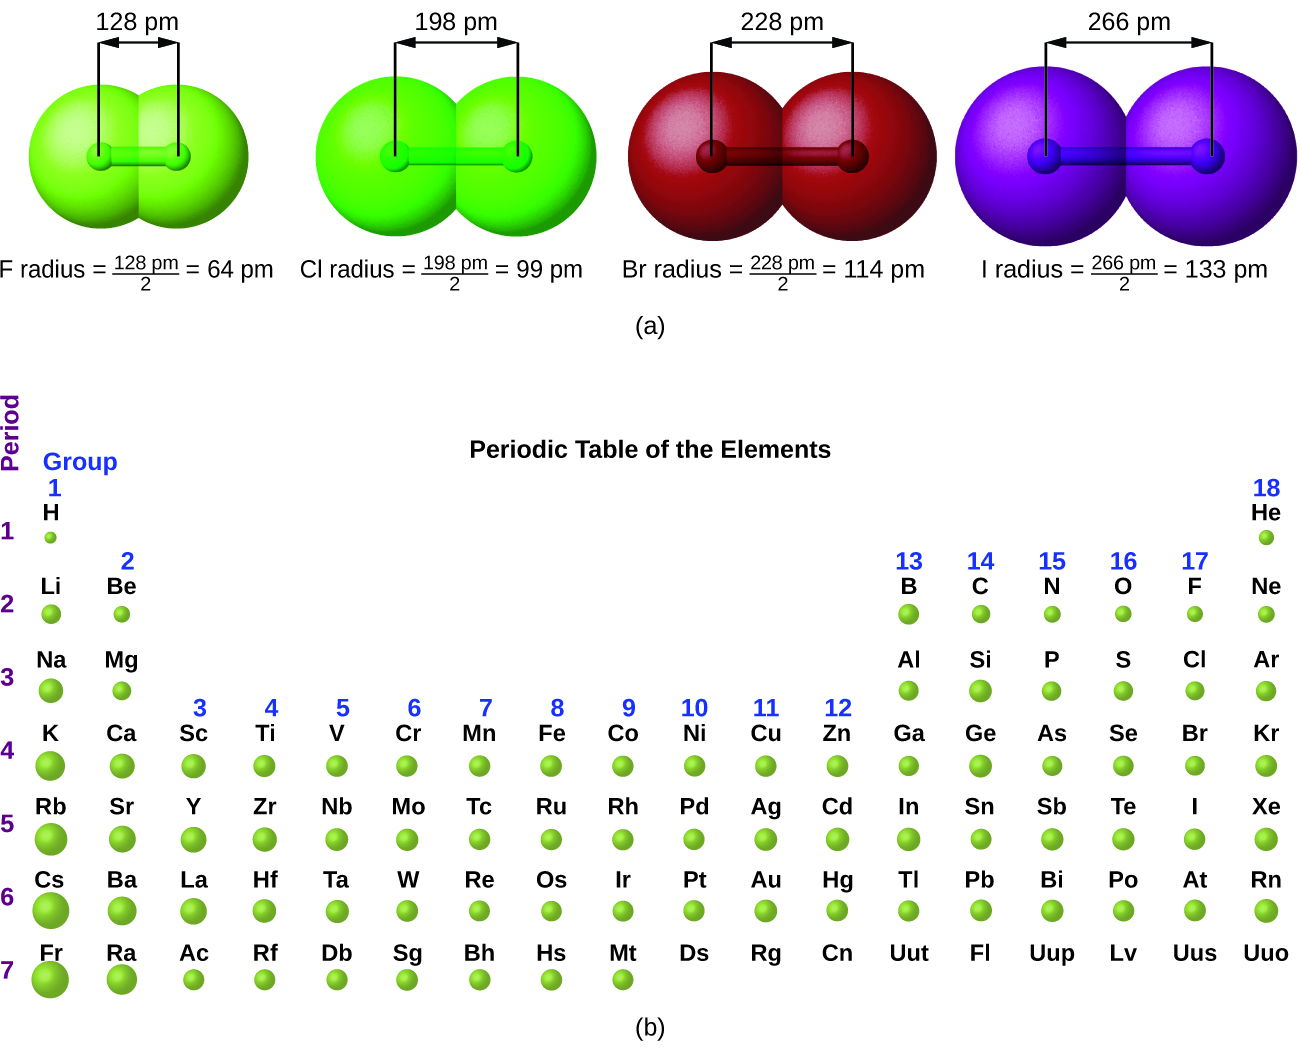
The quantum mechanical picture makes it difficult to establish a definite size of an atom. However, there are several practical ways to define the radius of atoms and, thus, to determine their relative sizes. We will use the covalent radius (Figure 8), which is defined as one-half the distance between the nuclei of two identical atoms when they are joined by a covalent bond (this measurement is possible because atoms within molecules still retain much of their atomic identity). Going down a group, the principal quantum number, n, increases by one for each element. Thus, the electrons are being added to a region of space that is increasingly distant from the nucleus. Consequently, the size of the atom (and its covalent radius) must increase as we increase the distance of the outermost electrons from the nucleus. This trend is illustrated for the covalent radii of the halogens in Table 1 and Figure 8a. The trends for the entire periodic table can be seen in Figure 8b.
| Atom | Covalent radius (pm) | Nuclear charge |
|---|---|---|
| F | 64 | +9 |
| Cl | 99 | +17 |
| Br | 114 | +35 |
| I | 133 | +53 |
| At | 148 | +85 |
| Table 1. Covalent Radii of the Halogen Group Elements | ||
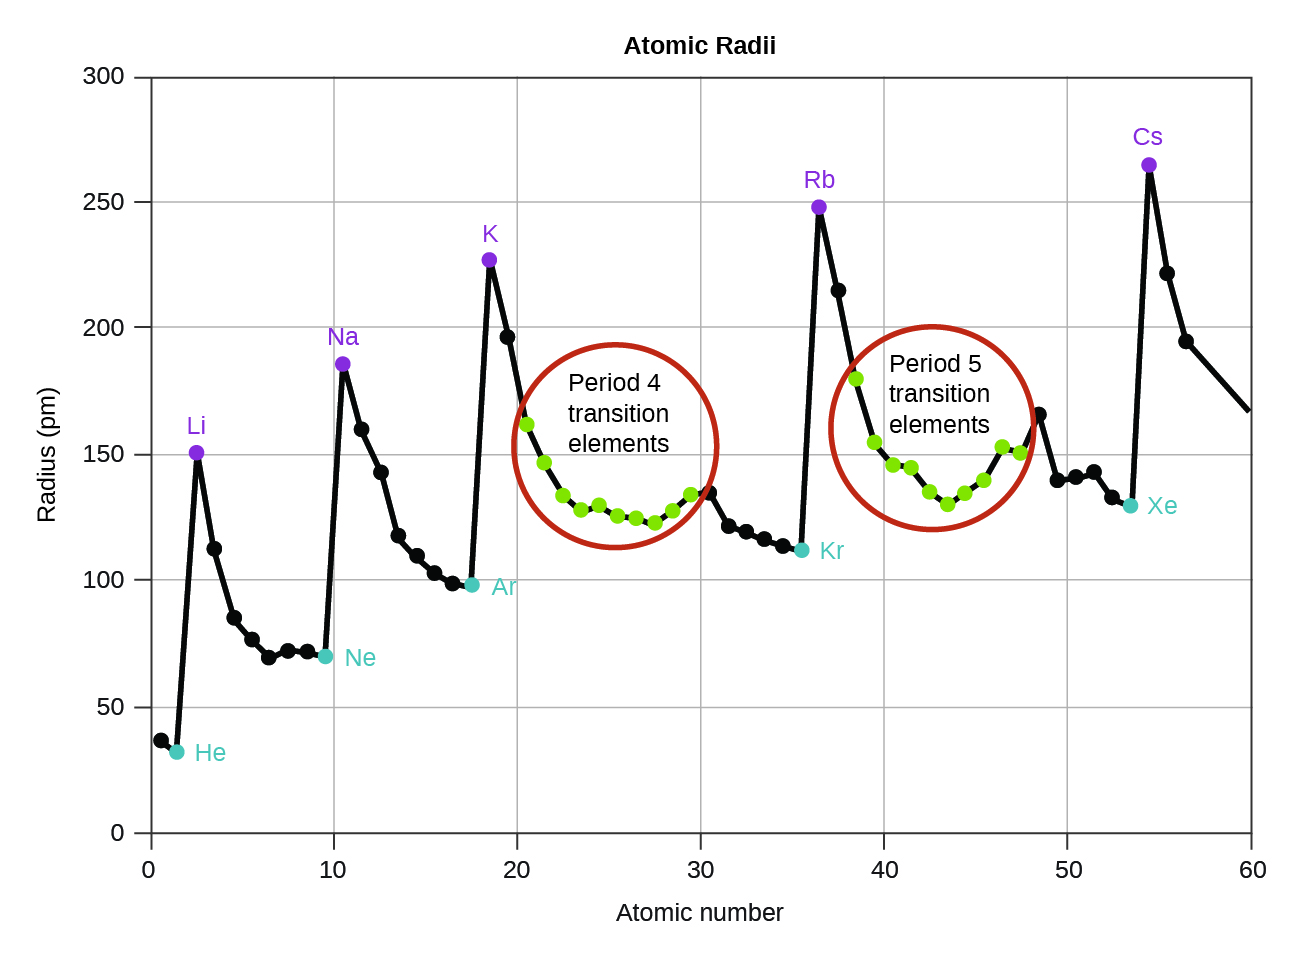
As we move across a period from left to right, we generally find that each element has a smaller covalent radius than the element preceding it (Figure 9).
This can be explained with the concept of effective nuclear charge, Zeff. This is the pull exerted on a specific electron by the nucleus, taking into account any electron–electron repulsions. For hydrogen, there is only one electron and so the nuclear charge (Z) and the effective nuclear charge (Zeff) are equal. For all other atoms, the inner electrons partially shield the outer electrons from the pull of the nucleus, and thus:
Shielding is determined by the probability of another electron being between the electron of interest and the nucleus, as well as by the electron–electron repulsions the electron of interest encounters. Core electrons are adept at shielding, while electrons in the same valence shell do not block the nuclear attraction experienced by each other as efficiently. Thus, each time we move from one element to the next across a period, Z increases by one, but the shielding increases only slightly. Thus, Zeff increases as we move from left to right across a period. The stronger pull (higher effective nuclear charge) experienced by electrons on the right side of the periodic table draws them closer to the nucleus, making the covalent radii smaller.
Thus, the outermost or valence electrons are easiest to remove because they have the highest energies, are shielded more, and are farthest from the nucleus. As a general rule, when the representative elements form cations, they do so by the loss of the ns or np electrons that were added last in the Aufbau process. The transition elements, on the other hand, lose the ns electrons before they begin to lose the (n – 1)d electrons, as discussed above.
Example 3
Sorting Atomic Radii
Predict the order of increasing covalent radius for Ge, Fl, Br, Kr.
Solution
Radius increases as we move down a group, so Ge < Fl (Note: Fl is the symbol for flerovium, element 114, NOT fluorine). Radius decreases as we move across a period, so Kr < Br < Ge. Putting the trends together, we obtain Kr < Br < Ge < Fl.
Check Your Learning
Give an example of an atom whose size is smaller than fluorine.
Answer:
Ne or He
Ch3.8 Variation in Ionic Radii
Ionic radius is the measure used to describe the size of an ion. A cation always has fewer electrons and the same number of protons as the parent atom; it is smaller than the atom from which it is derived (Figure 10). For example, the covalent radius of an aluminum atom (1s22s22p63s23p1) is 118 pm, whereas the ionic radius of an Al3+ (1s22s22p6), with only core electrons remaining, is 68 pm. Cations with larger charges are smaller than cations with smaller charges (e.g., V2+ has an ionic radius of 79 pm, while that of V3+ is 64 pm). Proceeding down the groups of the periodic table, we find that cations of successive elements with the same charge generally have larger radii, corresponding to an increase in the principal quantum number, n.

An anion (negative ion) is formed by the addition of one or more electrons to the valence shell of an atom. This results in a greater repulsion among the electrons and a decrease in Zeff per electron. Both effects cause the radius of an anion to be larger than that of the parent atom (Figure 10). For example, a sulfur atom ([Ne]3s23p4) has a covalent radius of 104 pm, whereas the ionic radius of the sulfide anion ([Ne]3s23p6) is 170 pm. For consecutive elements proceeding down any group, anions have larger principal quantum numbers and, thus, larger radii.
Atoms and ions that have the same electron configuration are said to be isoelectronic. Examples of isoelectronic species are N3–, O2–, F–, Ne, Na+, Mg2+, and Al3+ (1s22s22p6). Another isoelectronic series is P3–, S2–, Cl–, Ar, K+, Ca2+, and Sc3+ ([Ne]3s23p6). For atoms or ions that are isoelectronic, the number of protons determines the size. The greater the nuclear charge, the smaller the radius in a series of isoelectronic ions and atoms.
Ch3.9 Variation in Ionization Energies
The amount of energy required to remove the most loosely bound electron from a gaseous atom in its ground state is called its first ionization energy (IE1). The first ionization energy for an element, X, is the energy required to form a cation with +1 charge:
The energy required to remove the second most loosely bound electron is called the second ionization energy (IE2).
The energy required to remove the third electron is the third ionization energy, and so on. Energy is always required to remove electrons from atoms or ions, so ionization processes are endothermic and IE values are always positive. For larger atoms, the most loosely bound electron is located farther from the nucleus and so is easier to remove. Thus, as size (atomic radius) increases, the ionization energy should decrease. Relating this logic to what we have just learned about radii, we would expect first ionization energies to decrease down a group and to increase across a period.
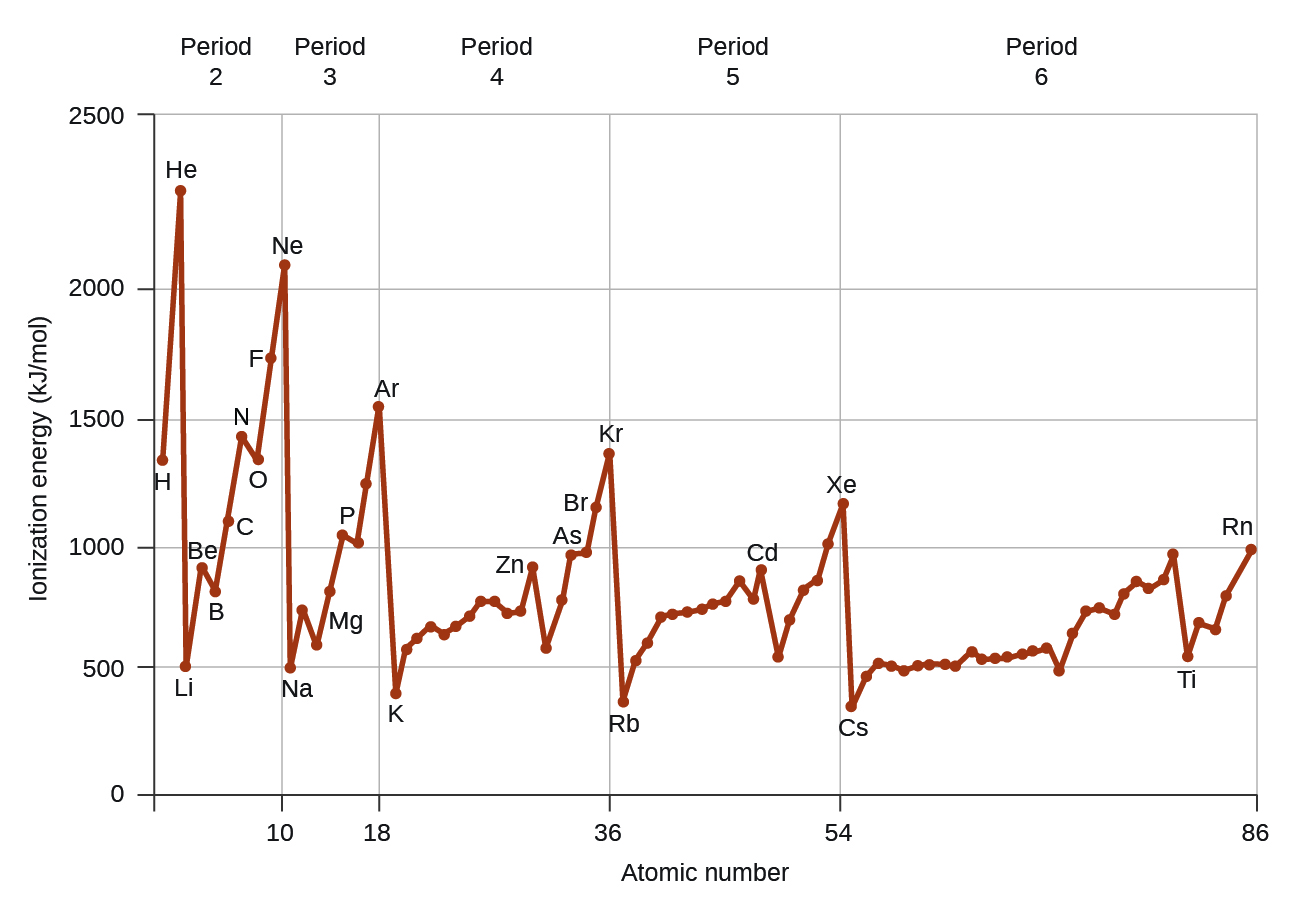
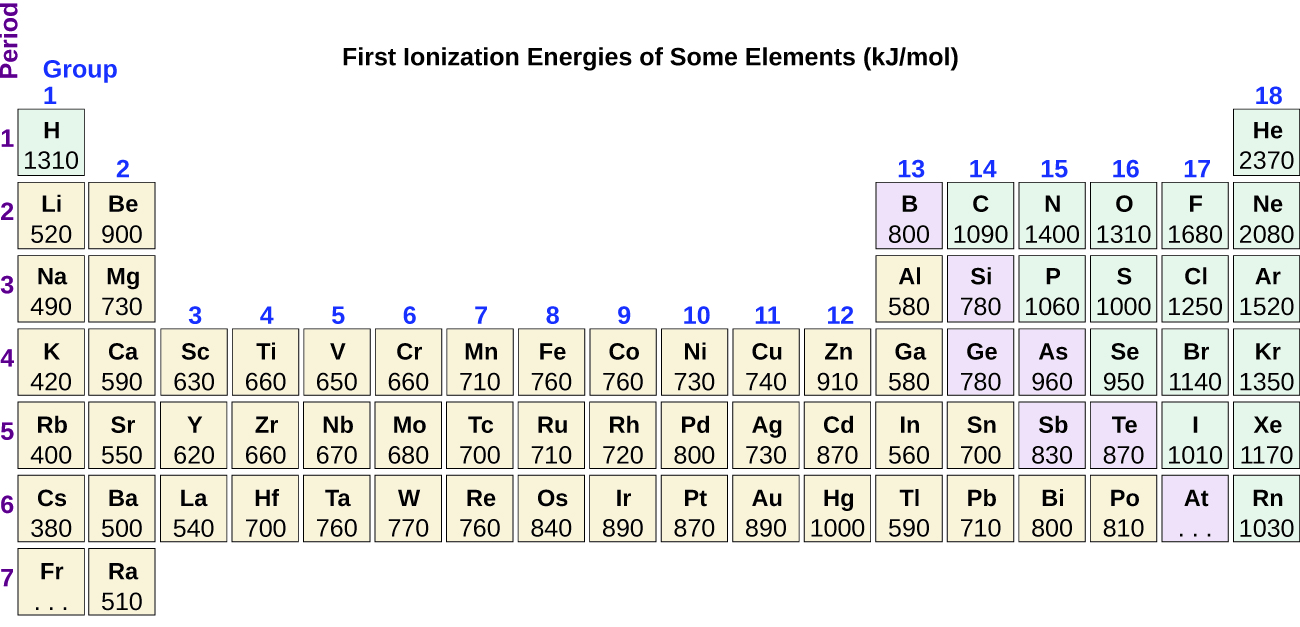
Figure 11 graphs the relationship between the first ionization energy and the atomic number of several elements. The values of first ionization energy for the elements are given in Figure 12. Within a period, the IE1 generally increases with increasing Z. Down a group, the IE1 value generally decreases with increasing Z. There are some systematic deviations from this trend. For example, the IE1 of boron is less than that of beryllium even though the nuclear charge of boron is greater by one proton. This is because the energy of the subshells increases as l increases, due to penetration and shielding. Within any one shell, the s electrons are lower in energy than the p electrons. This means that an s electron is harder to remove from an atom than a p electron in the same shell. The electron removed during the ionization of beryllium ([He]2s2) is an s electron, whereas the electron removed during the ionization of boron ([He]2s22p1) is a p electron; this results in a lower first ionization energy for boron, even though its nuclear charge is greater by one proton. Thus, we see a small deviation from the predicted trend occurring each time a new subshell begins.
Another deviation occurs as orbitals become more than one-half filled. The first ionization energy for oxygen is slightly less than that for nitrogen, despite the general trend in increasing IE1 values across a period. Looking at the orbital diagram of oxygen, we can see that removing one electron will eliminate the electron–electron repulsion caused by pairing the electrons in the 2p orbital and will result in a half-filled orbital (which is energetically favorable). Analogous changes occur in succeeding periods (note the dip for sulfur after phosphorus in Figure 11 and 12).
Removing an electron from a cation is more difficult than removing an electron from a neutral atom because of the greater electrostatic attraction to the cation. Likewise, removing an electron from a cation with a higher positive charge is more difficult than removing an electron from an ion with a lower charge. Thus, successive ionization energies for one element always increase. As seen in Table 6, there is a large increase in the ionization energies (highlighted) for each element. This jump corresponds to removal of the core electrons, which are harder to remove than the valence electrons. For example, Sc and Ga both have three valence electrons, so the rapid increase in ionization energy occurs after the third ionization.
| Element | IE1 | IE2 | IE3 | IE4 | IE5 | IE6 | IE7 |
|---|---|---|---|---|---|---|---|
| K | 419 | 3069 | 4438 | 5876 | 7975 | 9620 | 11385 |
| Ca | 590 | 1145 | 4941 | 6465 | 8142 | 10496 | 12350 |
| Sc | 633 | 1244 | 2388 | 7130 | 8877 | 10720 | 13314 |
| Ga | 579 | 1982 | 2962 | 6194 | 8299 | 10874 | 13585 |
| Ge | 760 | 1537 | 3301 | 4409 | 9012 | 11183 | 13981 |
| As | 947 | 1949 | 2731 | 4834 | 6040 | 12303 | 14183 |
| Table 6. Successive Ionization Energies for Selected Elements (kJ/mol) | |||||||
Example 4
Ranking Ionization Energies
Predict the order of increasing energy for the following processes: IE1 for Al, IE1 for Tl, IE3 for Al.
Solution
Removing the 6p1 electron from Tl is easier than removing the 3p1 electron from Al because the higher n orbital is farther from the nucleus, so IE1(Tl) < IE1(Al). Ionizing the third electron from Al (Al2+ → Al3+ + e-) requires more energy because the cation Al2+ exerts a stronger pull on the electron than the neutral Al atom, so IE1(Al) < IE3(Al). Putting this all together, we obtain: IE1(Tl) < IE1(Al) < IE3(Al).
Check Your Learning
Which has the lowest value for IE1: O, Po, Pb, or Ba?
Answer:
Ba
Ch3.10 Variation in Electron Affinities
The electron affinity [EA] is the energy change for the process of adding an electron to a gaseous atom to form an anion (negative ion).
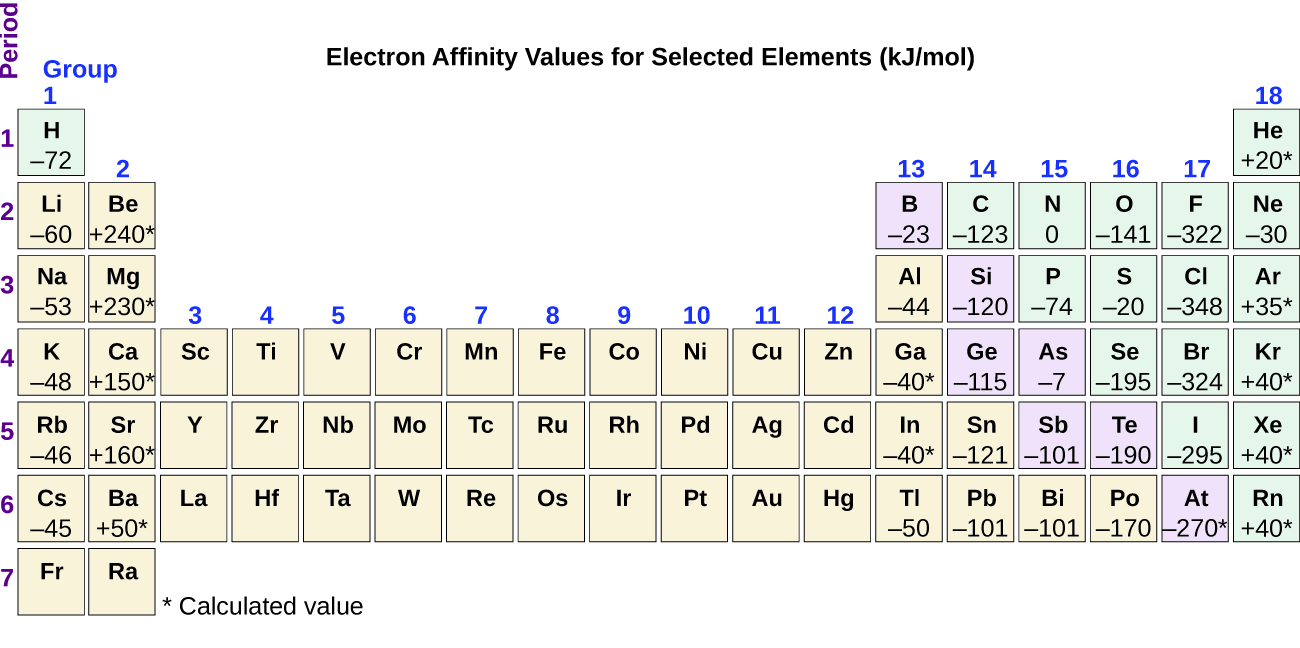
This process can be either endothermic or exothermic, depending on the element, and the ΔE of the reaction is defined as ΔE = -EA. The -EA of some of the elements is given in Figure 13. You can see that many of these elements have negative values of EA, which means that energy is released when the gaseous atom accepts an electron. However, for some elements, energy is required for the atom to become negatively charged and the value of their EA is positive. Just as with ionization energy, subsequent EA values are associated with forming ions with more charge. The second EA is the energy associated with adding an electron to an anion to form a –2 ion, and so on.
As we might predict, it becomes easier to add an electron across a series of atoms as the effective nuclear charge of the atoms increases. As we go from left to right across a period, EAs tend to become more negative. The exceptions found among the elements of group 2 (2A), group 15 (5A), and group 18 (8A) can be understood based on the electronic structure of these groups. The noble gases, group 18 (8A), have a completely filled shell and the incoming electron must be added to a higher n level, which is more difficult to do. Group 2 (2A) has a filled ns subshell, and so the next electron added goes into the higher energy np. Finally, group 15 (5A) has a half-filled np subshell and the next electron must be paired with an existing np electron. In all of these cases, the initial relative stability of the electron configuration disrupts the trend in EA.
We also might expect the atom at the top of each group to have the largest EA; their first ionization potentials suggest that these atoms have the largest effective nuclear charges. However, as we move down a group, we see that the second element in the group most often has the greatest EA. The reduction of the EA of the first member can be attributed to the small size of the n = 2 shell and the resulting large electron–electron repulsions. For example, chlorine, with an EA value of –348 kJ/mol, has the highest value of any element in the periodic table. The EA of fluorine is –322 kJ/mol. When we add an electron to a fluorine atom to form a fluoride anion (F–), we add an electron to the n = 2 shell. The electron is attracted to the nucleus, but there is also significant repulsion from the other electrons already present in this small valence shell. The chlorine atom has the same electron configuration in the valence shell, but because the entering electron is going into the n = 3 shell, it occupies a considerably larger region of space and the electron–electron repulsions are reduced. The entering electron does not experience as much repulsion and the chlorine atom accepts an additional electron more readily.
The properties discussed thus far (size of atoms and ions, effective nuclear charge, ionization energies, and electron affinities) are central to understanding chemical reactivity. For example, because fluorine has an energetically favorable EA and a large energy barrier to ionization (IE), it is much easier to form fluorine anions than cations. Metallic properties including conductivity and malleability (the ability to be formed into sheets) depend on having electrons that can be removed easily. Thus, metallic character increases as we move down a group and decreases across a period in the same trend observed for atomic size because it is easier to remove an electron that is farther away from the nucleus.
Ch3.11 Ionic Compounds
When an element composed of atoms that readily lose electrons (a metal) reacts with an element composed of atoms that readily gain electrons (a nonmetal), a transfer of electrons usually occurs, producing ions. The compound formed by this transfer is stabilized by the electrostatic attractions (ionic bonds) between the ions of opposite charge present in the compound. For example, when each sodium atom in a sample of sodium metal (group 1) gives up one electron to form a sodium cation, Na+, and each chlorine atom in a sample of chlorine gas (group 17) accepts one electron to form a chloride anion, Cl−, the resulting compound, NaCl, is composed of sodium ions and chloride ions in the ratio of one Na+ ion for each Cl− ion. Similarly, each calcium atom (group 2) can give up two electrons and transfer one to each of two chlorine atoms to form CaCl2, which is composed of Ca2+ and Cl− ions in the ratio of one Ca2+ ion to two Cl− ions.
A compound that contains ions and is held together by ionic bonds is called an ionic compound. The periodic table can help us recognize many of the compounds that are ionic: When a metal is combined with one or more nonmetals, the compound is usually ionic. This guideline works well for predicting ionic compound formation for most of the compounds typically encountered in an introductory chemistry course. However, it is not always true (for example, aluminum chloride, AlCl3, is not ionic).
You can often recognize ionic compounds because of their properties. Ionic compounds are solids that typically melt at high temperatures and boil at even higher temperatures. For example, sodium chloride melts at 801 °C and boils at 1413 °C. (As a comparison, the molecular compound water melts at 0 °C and boils at 100 °C.) In solid form, an ionic compound is not electrically conductive because its ions are unable to flow (“electricity” is the flow of charged particles). When molten, however, it can conduct electricity because its ions are able to move freely through the liquid (Figure 14).
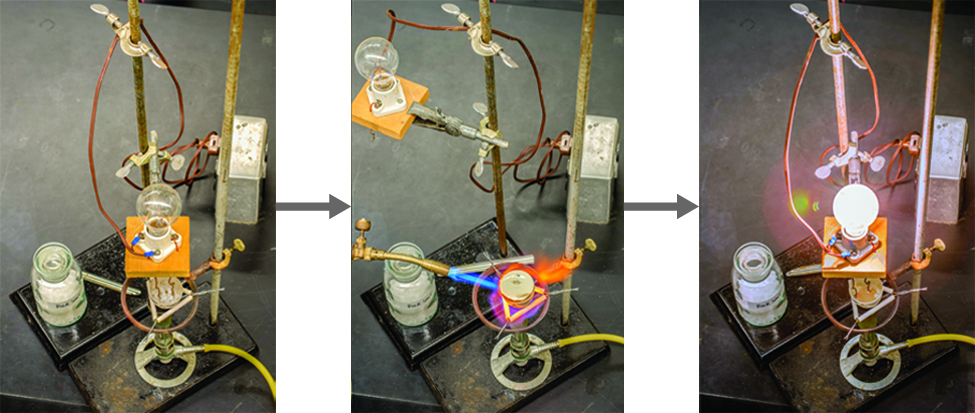
Watch this video to see a mixture of salts melt and conduct electricity.
In every ionic compound, the total number of positive charges of the cations equals the total number of negative charges of the anions. Thus, ionic compounds are electrically neutral overall, even though they contain positive and negative ions. We can use this observation to help us write the formula of an ionic compound. The formula of an ionic compound must have a ratio of ions such that the numbers of positive and negative charges are equal.
Example 5
Predicting the Formula of an Ionic Compound
The gemstone sapphire (Figure 15) is mostly a compound of aluminum and oxygen that contains aluminum cations, Al3+, and oxygen anions, O2−. What is the formula of this compound?

Solution
Because the ionic compound must be electrically neutral, it must have the same number of positive and negative charges. Two aluminum ions, each with a charge of 3+, would give us six positive charges, and three oxide ions, each with a charge of 2−, would give us six negative charges. The formula would be Al2O3.
Check Your Learning
Predict the formula of the ionic compound formed between the sodium cation, Na+, and the sulfide anion, S2−.
Answer:
Na2S
Many ionic compounds contain polyatomic ions as the cation, the anion, or both. As with simple ionic compounds, these compounds must also be electrically neutral, so their formulas can be predicted by treating the polyatomic ions as discrete units. We use parentheses in a formula to indicate a group of atoms that behave as a unit. For example, the formula for calcium phosphate, one of the minerals in our bones, is Ca3(PO4)2. This formula indicates that there are three calcium ions (Ca2+) for every two phosphate (PO43−) groups. The PO43− groups are discrete units, each consisting of one phosphorus atom and four oxygen atoms, and having an overall charge of 3−. The compound is electrically neutral, and its formula shows a total count of three Ca, two P, and eight O atoms.
Example 6
Predicting the Formula of a Compound with a Polyatomic Anion
Baking powder contains calcium dihydrogen phosphate, an ionic compound composed of the ions Ca2+ and H2PO4−. What is the formula of this compound?
Solution
The positive and negative charges must balance, and this ionic compound must be electrically neutral. Thus, we must have two negative charges to balance the 2+ charge of the calcium ion. This requires a ratio of one Ca2+ ion to two H2PO4− ions. We designate this by enclosing the formula for the dihydrogen phosphate ion in parentheses and adding a subscript 2. The formula is Ca(H2PO4)2.
Check Your Learning
Predict the formula of the ionic compound formed between the lithium ion and the peroxide ion, O22− (Hint: Use the periodic table to predict the sign and the charge on the lithium ion.)
Answer:
Li2O2
Because an ionic compound is not made up of single, discrete molecules, it may not be properly symbolized using a molecular formula. Instead, ionic compounds must be symbolized by a formula indicating the relative numbers of its constituent ions. For compounds containing only monatomic ions (such as NaCl) and for many compounds containing polyatomic ions (such as CaSO4), these formulas are just the empirical formulas introduced earlier in this chapter. However, the formulas for some ionic compounds containing polyatomic ions are not empirical formulas. For example, the ionic compound sodium oxalate is comprised of Na+ and C2O42− ions combined in a 2:1 ratio, and its formula is written as Na2C2O4. The subscripts in this formula are not the smallest-possible whole numbers, as each can be divided by 2 to yield the empirical formula, NaCO2. This is not the accepted formula for sodium oxalate, however, as it does not accurately represent the compound’s polyatomic anion, C2O42−.
Ch3.12 Energies, Ions, and Ionic Compounds
Formation of an ion pair by transfer of an electron from an Li atom to an H atom results in an overall lowering of the total energy of the two nuclei and four electrons involved. How and why this occurs is best seen if we break ion-pair formation into three simpler steps and consider the energy change involved in each. The three steps are
- Removal of the 2s electron from an Li atom to form an Li+ ion.
- Addition of that same electron to an H atom to form an H– ion.
- The coming together of the two ions to form an ion pair.
The energy required in step 1 is the first ionization energy of lithium, which is 520 kJ mol–1. See Figure 9 for a visual representation of the energy "cost" of ionization.
While energy is needed to accomplish step 1, we find that energy is released in step 2 when a hydrogen atom accepts an electron and becomes a hydride ion. The reason for this can be seen in the formation of LiH ion pair dot density diagram. The second electron acquired by the hydrogen atom can pair up with the electron already in the 1s orbital without contradicting the Pauli exclusion principle. As a result, the new electron can move in close enough to the hydrogen nucleus to be held fairly firmly, lowering its energy significantly. Although the paired electrons repel each other somewhat, this is not enough to offset the attraction of the nucleus for both.
Since the energy of the electron is lowered, the law of conservation of energy requires that the same quantity of energy must be released when a hydrogen atom is transformed into a hydride ion. The energy released when an electron is acquired by an atom is its electron affinity, and for hydrogen it is 73 kJ mol–1.
Since 520 kJ mol–1 is required to remove an electron from a lithium atom, while 73 kJ mol–1 is released when the electron is donated to a hydrogen atom, it follows that transfer of an electron from a lithium to a hydrogen atom requires (520 – 73) kJ mol–1 = 447 kJ mol–1. This net energy change can best be seen in Figure 16.
At room temperature processes which require such a large quantity of energy are extremely unlikely. Indeed the transfer of the electron would be impossible if it were not for step 3, the close approach of the two ions. When oppositely charged particles move closer to each other, their potential energy decreases and they release energy. The energy released when lithium ions and hydride ions come together to 160 pm under the influence of their mutual attraction is 690 kJ mol–1, more than enough to offset the 447 kJ mol–1 needed to transfer the electron. Thus there is a net release of (690 – 447) kJ mol–1 = 243 kJ mol–1 from the overall process. The transfer of the electron from lithium to hydrogen and the formation of an Li+H– ion pair results in an overall lowering of energy, as seen in Figure 16 below.
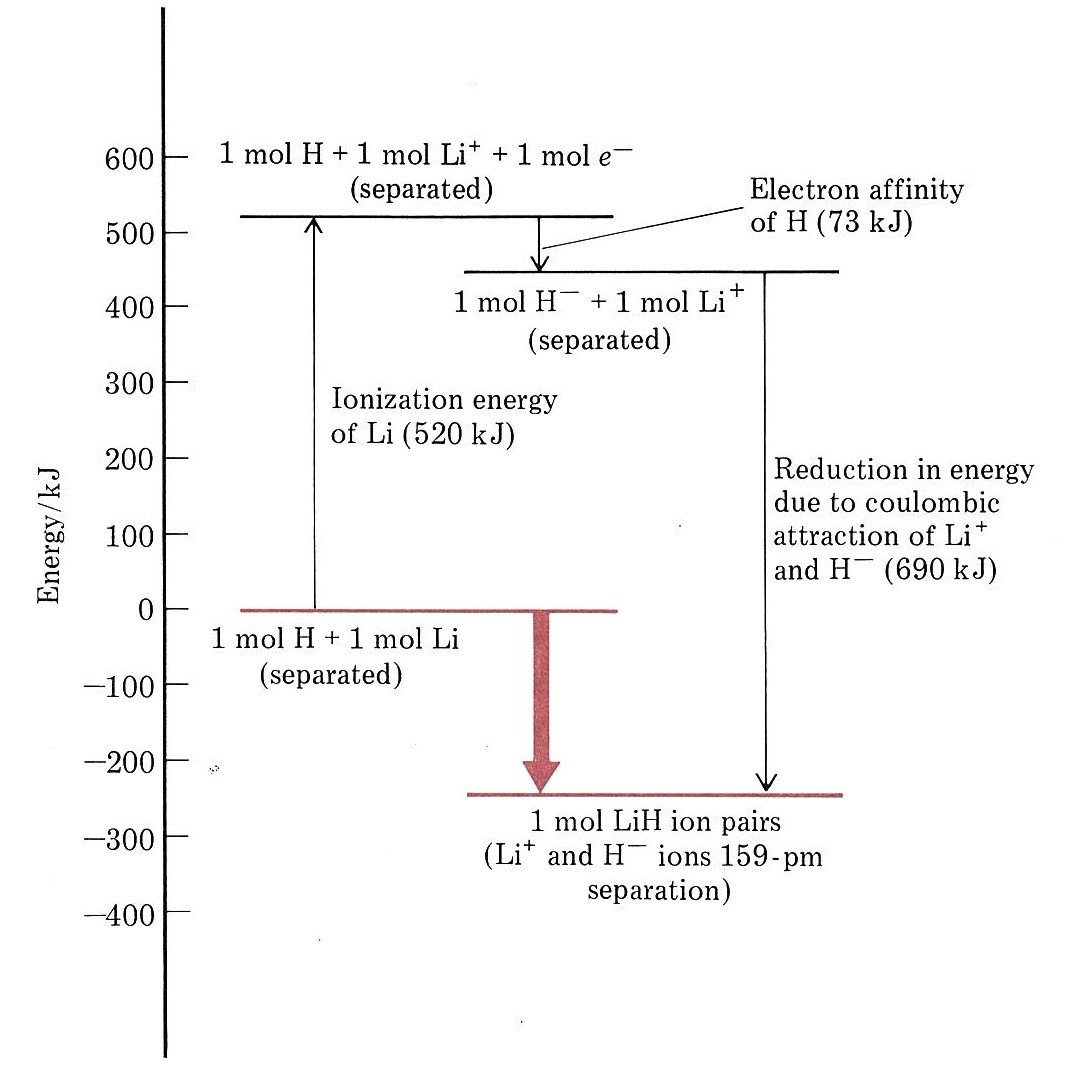
In the above figure, the energy change in each step and the overall change are illustrated diagrammatically. As in the case of atomic structure, where electrons occupy orbitals having the lowest allowable energy, a collection of atoms tends to rearrange its constituent electrons so as to minimize its total energy. Formation of a lithium hydride ion pair is energetically “downhill” and therefore favored.
The Ionic Crystal Lattice
We just considered what would happen if a single Li atom and a single H atom were combined. When a large number of atoms of each kind combine, the result is somewhat different. Electrons are again transferred, and ions are formed, but the ions no longer pair off in twos. Instead, under the influence of their mutual attractions and repulsions, they collect together in much larger aggregates, eventually forming a three-dimensional array like that shown in the Figure 17. On the macroscopic level a crystal of solid lithium hydride is formed.
The formation of such an ionic crystal lattice results in a lower potential energy than is possible if the ions only group into pairs. It is easy to see from the figure of the crystal lattice why this should be so. In an ion pair each Li+ ion is close to only one H– ion, whereas in the crystal lattice it is close to no less than six ions of opposite charge. Conversely each H– ion is surrounded by six Li+ ions. In the crystal lattice therefore, more opposite charges are brought closer together than is possible for separate ion pairs and the potential energy is lower by an additional 227 kJ mol–1. The arrangement of the ions in a crystal of LiH corresponds to the lowest possible energy. If there were an alternative geometrical arrangement bringing even more ions of opposite charge even closer together than that shown in the figure, the Li+ ions and H– ions would certainly adopt it.
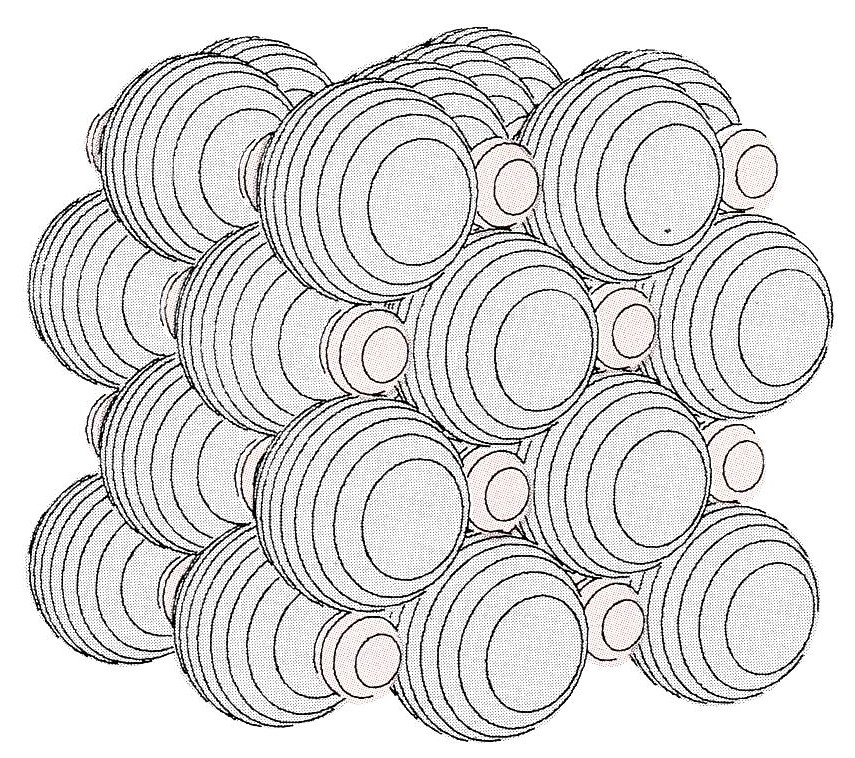
 Figure 17. A portion of the ionic crystal lattice of lithium hydride, LiH. (a) Lithium ions, Li+, (color) and hydride ions, H–, (gray) are shown full size. In a macroscopic crystal the regular array of ions extends indefinitely in all directions. (b) “Exploded” view of the lattice, showing that each Li+ ion (color) is surrounded by six H– ions (gray), and vice versa. (Computer-generated).
Calculating (Ionic) Lattice Energies
The lattice energy of nearly any ionic solid can be calculated rather accurately using a modified form of Coulomb's law:
where Q1 and Q2 are the charges on the ions and r0 is the internuclear distance. U, which is always a positive number, represents the amount of energy required to dissociate 1 mol of an ionic solid into the gaseous ions. Hence, the lattice energy is directly related to the product of the ion charges and inversely related to the internuclear distance. The value of the constant k′ depends on the specific arrangement of ions in the solid lattice and their valence electron configurations.
If we assume that ΔV = 0, then the lattice energy, U, is approximately equal to the change in enthalpy, ΔH:
Representative values for calculated lattice energies, which range from about 600 to 10,000 kJ/mol, are listed in Table 7. Energies of this magnitude can be decisive in determining the chemistry of the elements.
| Substance | U (kJ/mol) |
|---|---|
| NaI | 682 |
| CaI2 | 1971 |
| MgI2 | 2293 |
| NaOH | 887 |
| Na2O | 2481 |
| NaNO3 | 755 |
| Ca3(PO4)2 | 10,602 |
| CaCO3 | 2804 |
|
Source: Data from CRC Handbook of Chemistry and Physics (2004).
|
|
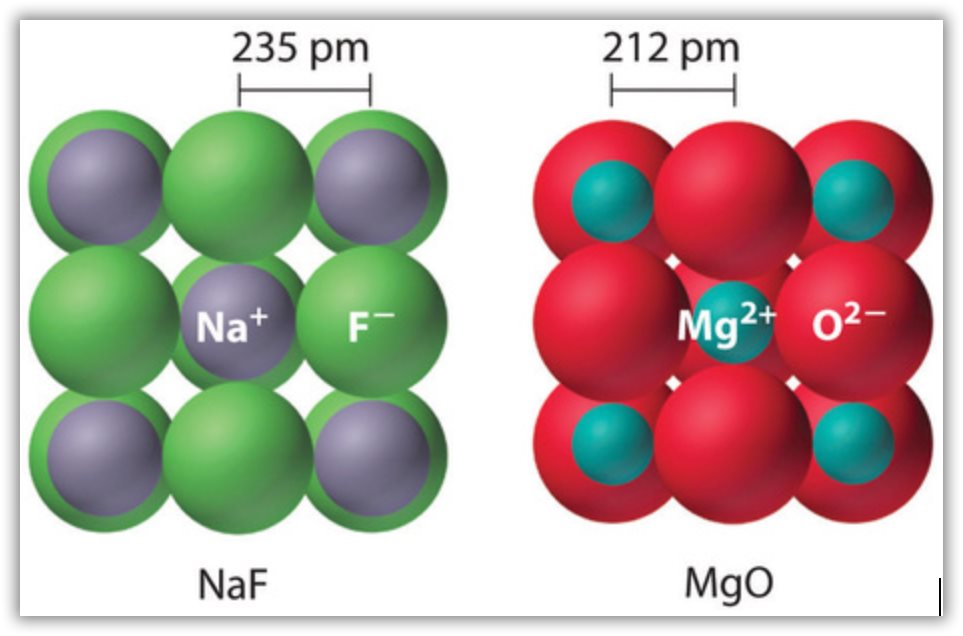
Because the lattice energy depends on the product of the charges of the ions, a salt having a metal cation with a +2 charge (M2+) and a nonmetal anion with a −2 charge (X2−) will have a lattice energy four times greater than one with M+ and X−, assuming the ions are of comparable size (and have similar internuclear distances). For example, the calculated value of U for NaF is 910 kJ/mol, whereas U for MgO (containing Mg2+ and O2− ions) is 3795 kJ/mol.
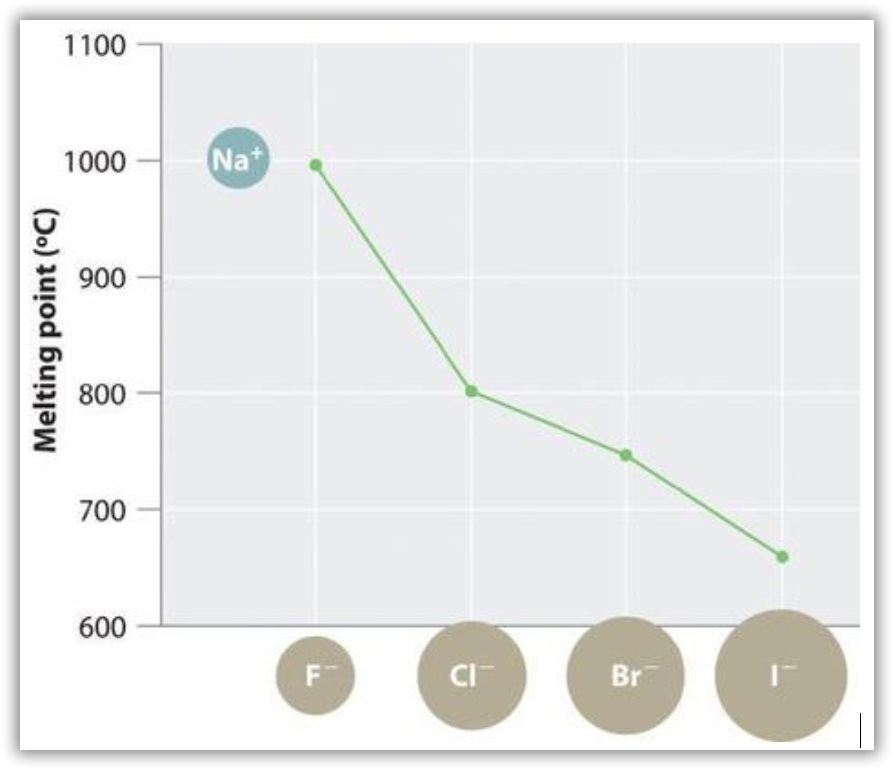
Because lattice energy is inversely related to the internuclear distance, it is also inversely proportional to the size of the ions. This effect is illustrated in Figure 18, which shows that lattice energy decreases for the series LiX, NaX, and KX as the radius of X− increases. Because r0 is the sum of the ionic radii of the cation and the anion (r0 = r+ + r−), r0 increases as the cation becomes larger in the series, so the magnitude of U decreases. A similar effect is seen when the anion becomes larger in a series of compounds with the same cation.
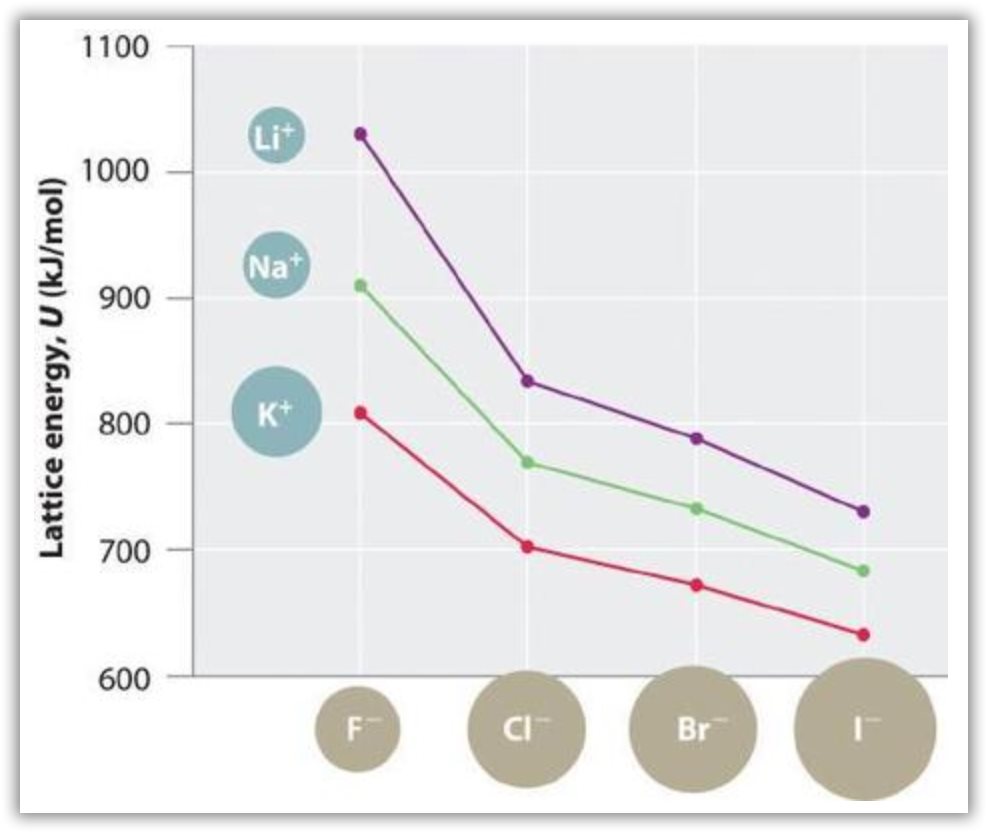
Because the ionic radii of the cations decrease in the order K+ > Na+ > Li+ for a given halide ion, the lattice energy decreases smoothly from Li+ to K+. Conversely, for a given alkali metal ion, the fluoride salt always has the highest lattice energy and the iodide salt the lowest.
Lattice energies are highest for substances with small, highly charged ions.
Example 7
Arrange GaP, BaS, CaO, and RbCl in order of increasing lattice energy.
Solution:
We can predict the order of the lattice energies based on the charges on the ions. For compounds with ions with the same charge, use the relative sizes of the ions to make this prediction.
The compound GaP, which is used in semiconductor electronics, contains Ga3+ and P3− ions; the compound BaS contains Ba2+ and S2− ions; the compound CaO contains Ca2+ and O2− ions; and the compound RbCl has Rb+ and Cl− ions. We know from Coulomb's law that lattice energy is directly proportional to the product of the ionic charges. Consequently, we expect RbCl, with a (−1)(+1) term in the numerator, to have the lowest lattice energy, and GaP, with a (+3)(−3) term, the highest. To decide whether BaS or CaO has the greater lattice energy, we need to consider the relative sizes of the ions because both compounds contain a +2 metal ion and a −2 chalcogenide ion. Because Ba2+ lies below Ca2+ in the periodic table, Ba2+ is larger than Ca2+. Similarly, S2− is larger than O2−. Because the cation and the anion in BaS are both larger than the corresponding ions in CaO, the internuclear distance is greater in BaS and its lattice energy will be lower than that of CaO. The order of increasing lattice energy is RbCl < BaS < CaO < GaP.
Check Your Learning
Arrange InAs, KBr, LiCl, SrSe, and ZnS in order of decreasing lattice energy.
Answer
InAs > ZnS > SrSe > LiCl > KBr
The Relationship between Lattice Energies and Physical Properties
The magnitude of the forces that hold an ionic substance together has a dramatic effect on many of its properties. The melting point, for example, is the temperature at which the individual ions have enough kinetic energy to overcome the attractive forces that hold them in place. At the melting point, the ions can move freely, and the substance becomes a liquid. Thus melting points vary with lattice energies for ionic substances that have similar structures. The melting points of the sodium halides (Figure 19), for example, decrease smoothly from NaF to NaI, following the same trend as seen for their lattice energies (Figure 18). Similarly, the melting point of MgO is 2825°C, compared with 996°C for NaF, reflecting the higher lattice energies associated with higher charges on the ions. In fact, because of its high melting point, MgO is used as an electrical insulator in heating elements for electric stoves.
The hardness of ionic materials—that is, their resistance to scratching or abrasion—is also related to their lattice energies. Hardness is directly related to how tightly the ions are held together electrostatically, which, as we saw, is also reflected in the lattice energy. As an example, MgO is harder than NaF, which is consistent with its higher lattice energy.
In addition to determining melting point and hardness, lattice energies affect the solubilities of ionic substances in water. In general, the higher the lattice energy, the less soluble a compound is in water. For example, the solubility of NaF in water at 25°C is 4.13 g/100 mL, but under the same conditions, the solubility of MgO is only 0.65 mg/100 mL, meaning that it is essentially insoluble.
High lattice energies lead to hard, insoluble compounds with high melting points.
The Born–Haber Cycle
In principle, lattice energies could be measured by combining gaseous cations and anions to form an ionic solid and then measuring the heat evolved. Unfortunately, measurable quantities of gaseous ions have never been obtained under conditions where heat flow can be measured. Instead, lattice energies are found using the experimentally determined enthalpy changes for other chemical processes, Hess’s law, and a thermochemical cycle called the Born–Haber cycle. Developed by Max Born and Fritz Haber in 1919, the Born–Haber cycle describes a process in which an ionic solid is conceptually formed from its component elements in a stepwise manner. You can read more about using the Born–Haber cycle to determine the lattice energy of CsF(s) here.
Ch3.13 Metallic Solids, Covalent Network Solid, and Molecular Solid
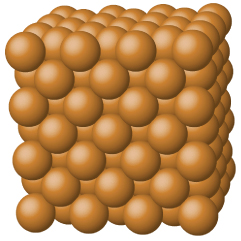
Metallic solids such as crystals of copper, aluminum, and iron are formed by metal atoms, Figure 20. The structure of metallic crystals is often described as a uniform distribution of atomic nuclei within a “sea” of delocalized electrons. The atoms within such a metallic solid are held together by a unique force known as metallic bonding that gives rise to many useful and varied bulk properties. All metallic solids exhibit high thermal and electrical conductivity, metallic luster, and malleability. Many are very hard and quite strong. Because of their malleability (the ability to deform under pressure or hammering), they do not shatter and, therefore, make useful construction materials. The melting points of the metals vary widely. Mercury is a liquid at room temperature, and the alkali metals melt below 200 °C. Several post-transition metals also have low melting points, whereas the transition metals melt at temperatures above 1000 °C. These differences reflect differences in strengths of metallic bonding among the metals.
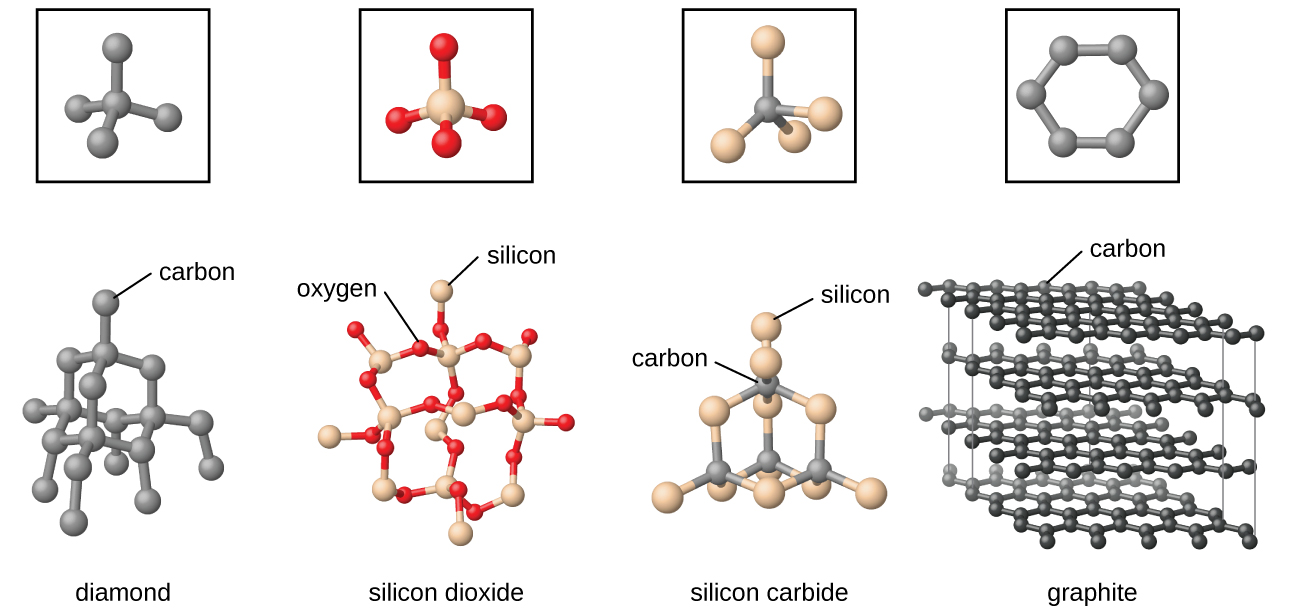
Covalent network solids include crystals of diamond, silicon, some other nonmetals, and some covalent compounds such as silicon dioxide (sand) and silicon carbide (carborundum, the abrasive on sandpaper). The atoms in these solids are held together by a network of covalent bonds, as shown in Figure 21. To break or to melt a covalent network solid, covalent bonds must be broken. Because covalent bonds are relatively strong, covalent network solids are typically characterized by hardness, strength, and high melting points. For example, diamond is one of the hardest substances known and melts above 3500 °C. Many minerals also have networks of covalent bonds.
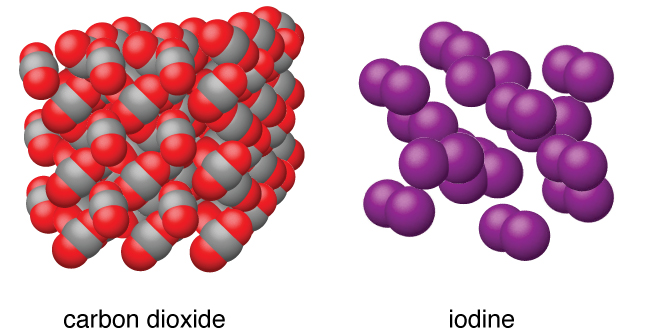
Molecular solids, such as ice, sucrose (table sugar), and iodine, as shown in Figure 22, are composed of neutral molecules. The strengths of the attractive forces between the units present in different crystals vary widely, as indicated by the melting points of the crystals. Small symmetrical molecules (nonpolar molecules), such as H2, N2, O2, and F2, have weak attractive forces and form molecular solids with very low melting points (below −200 °C). Substances consisting of larger, nonpolar molecules have larger attractive forces and melt at higher temperatures. Molecular solids composed of molecules with permanent dipole moments (polar molecules) melt at still higher temperatures. Examples include ice (melting point, 0 °C) and table sugar (melting point, 185 °C).