
Unit Three
Day 31: Equilibrium and Gibbs Free Energy
As you work through this section, if you find that you need a bit more background material to help you understand the topics at hand, you can consult “Chemistry: The Molecular Science” (5th ed. Moore and Stanitski) Chapter 16.7, and/or Chapter 14.7-14.9 in the Additional Reading Materials section.
D31.1 Gibbs Free Energy and Equilibrium
The standard Gibbs free energy change for a reaction indicates that a reaction is product-favored if ΔrG° < 0 and reactant-favored if ΔrG° > 0. A strongly product-favored reaction (large negative ΔrG°) has a large equilibrium constant (K>> 1) and a strongly reactant-favored reaction (large positive ΔrG°) has a very small equilibrium constant (K<<1, a very small fraction because K cannot be negative). These qualitative statements indicate that there may be a quantitative relationship between the equilibrium constant and ΔrG° for the reaction.
The reaction quotient, Q, was introduced as a convenient measure of the status of a reaction. When Q < K, the reaction proceeds spontaneously in the forward direction until equilibrium is reached and Q = K. Conversely, if Q > K, the process proceeds spontaneously in the reverse direction until equilibrium is achieved.
The relationship between ΔrG°, Q, and K is illustrated graphically in Figure 1 by plotting G vs. reaction progress. At zero reaction progress on the left, Q = 0, and the system is all reactants. On the right, when reaction progress is complete, Q = ∞, and the system is all products. On the left side of each of the three diagrams, where Q < K, the slope of the graph is negative. The slope is ΔrG at each point in the reaction, divided by an increment of reaction progress, Δ(progress). The negative slope corresponds to negative ΔrG, which predicts spontaneous forward reaction. In each diagram the slope gradually becomes less negative until it reaches zero. At this point ΔrG = 0, the system is at equilibrium, and Q = K. On the right side of each diagram, where Q > K, the slope becomes more and more positive, which means that ΔrG > 0. This predicts spontaneous reverse reaction. We could think of reaction progress as rolling down a Gibbs free energy hill, with equilibrium at the minimum G.
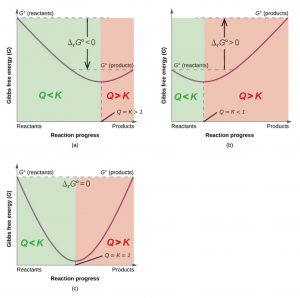
The position along the reaction progress scale at which equilibrium occurs depends on the sign of the standard Gibbs free energy change. When ΔrG° < 0, the minimum in the curve (Figure 1a) is further to the right, indicating that product concentrations are larger. When ΔrG° > 0, the minimum in the curve (Figure 1b) is further to the left, indicating that reactants predominate.
This equation makes quantitative the preceding discussion.
The Gibbs free energy change at any point along the reaction progress axis involves adjusting ΔrG° by the factor RT lnQ. When Q<1, the adjustment is negative (because lnQ is negative) and the slope of the graph is more negative than the slope of a line from G°(reactants) to G°(products.) When Q>1, the adjustment is positive and the slope of the graph is more positive than the slope of a line from G°(reactants) to G°(products.) At equilibrium, Q = K and ΔrG = 0, so
Note that in these last equations the equilibrium constant is represented by K°. The standard equilibrium constant, Kº, is either the concentration equilibrium constant (Kc) with each concentration divided by the standard-state concentration of 1 M or the pressure equilibrium constant (Kp) with each pressure divided by the standard-state pressure of 1 bar. Hence, Kº is unitless. Dividing by the standard-state concentration or pressure means that if concentrations in Kc are expressed in mol/L the numerical values of Kº and Kc are the same. Similarly, if partial pressures in Kp are expressed in bar, the numerical values of Kº and Kp are the same.
| Kº | ΔrG° | |
|---|---|---|
| > 1 | < 0 | Products are more abundant at equilibrium (product-favored). |
| < 1 | > 0 | Reactants are more abundant at equilibrium (reactant-favored). |
| = 1 | = 0 | Reactants and products are equally abundant at equilibrium. |
Exercise 1: Gibbs Free Energy and Equilibrium
Consider the reaction of ethylene with hydrogen, which forms ethane:
Answer the questions below, using the values from Appendix
Example 1
Calculating ΔrG under Nonstandard Conditions
What is the Gibbs free energy change for the process shown here under the specified conditions?
T = 25 °C, [latex]\text{P}_{\text{N}_2} = 0.870\;\text{bar}[/latex], [latex]\text{P}_{\text{H}_2} = 0.250\;\text{bar}[/latex], and [latex]\text{P}_{\text{NH}_3} = 12.9\;\text{bar}[/latex]
Solution
The equation relating free energy change to standard free energy change and reaction quotient may be used directly:
Because the computed value for ΔrG is positive, under these conditions products are converted to reactants.
Check Your Learning
Calculate the Gibbs free energy change for this same reaction at 25 °C in a 5.00 L mixture containing 0.100 mol of each gas. Is the reaction spontaneous under these conditions?
Answer:
ΔrG = 13.6 kJ/mol; no
Example 2
Calculating an Equilibrium Constant using Standard Gibbs Free Energy Change
Given that the standard Gibbs free energies of formation of Ag+(aq), Cl−(aq), and AgCl(s) are 77.1 kJ/mol, −131.2 kJ/mol, and −109.8 kJ/mol, respectively, calculate the equilibrium constant for the solubility of AgCl at 298.15 K.
Solution
The ΔrG° for this reaction is first computed using standard Gibbs free energies of formation for its reactants and products:
The equilibrium constant for the reaction may then be derived from its ΔG°:
Check Your Learning
Use the thermodynamic data provided in Appendix to calculate the equilibrium constant for the dissociation of dinitrogen tetroxide at 25 °C.
Answer:
K = 6.7
D31.2 Effect of Temperature
Recall that
Therefore:
This equation can be used to calculate K° at different temperatures, if we assume that ΔrH° and ΔrS° for a reaction have the same values at all temperatures. This is a good, but not perfect, assumption and we will use it in this course unless specified otherwise. It is not a good assumption if there is a phase change for a reactant or a product within the range of temperatures over which we assume ΔrH° and ΔrS° do not change.
Dividing both sides of the equation by -RT gives this linear equation:
A plot of ln K° vs. [latex]\frac{1}{T}[/latex] is called a van’t Hoff plot. The graph has slope = [latex]-\frac{{\Delta}H^{\circ}}{R}[/latex] and intercept = [latex]\frac{{\Delta}S^{\circ}}{R}[/latex]. If the concentrations of reactants and products are measured at various temperatures so that K° can be calculated at each temperature, both the reaction entropy change and enthalpy change can be obtained from a van’t Hoff plot.
Based on the equation for the van’t Hoff plot, for an exothermic reaction (ΔrH° < 0), K° decreases with increasing temperature, whereas for an endothermic reaction (ΔrH° > 0), K° increases with increasing temperature. This quantitative result agrees with the qualitative predictions made by applying Le Chatelier’s principle. It also shows that the magnitude of ΔrH° dictates how rapidly K° changes as a function of temperature. In contrast, ΔrS° affects the magnitude of K° but not its temperature dependence.
For example, suppose that K°1 and K°2 are the equilibrium constants for a reaction at temperatures T1 and T2, respectively:
Subtracting the two equations yields:
Thus calculating ΔrH° from tabulated standard formation enthalpies and measuring the equilibrium constant at one temperature allows us to calculate the equilibrium constant at any other temperature (assuming that ΔrH° and ΔrS° are independent of temperature).
Podia Question
Ammonium nitrate is an important fertilizer that supplies nitrogen to crops. It also can be used as an explosive to remove tree stumps from farm fields or in terrorist bombings. There are two reactions that can occur to produce the explosive effect. At lower temperatures ammonium nitrate decomposes to form dinitrogen monoxide and water vapor, but at higher temperatures it decomposes explosively to form nitrogen, water vapor, and oxygen. The reaction equations and thermodynamic parameters at 298 K are
(1) NH4NO3(s) → N2O(g) + 2 H2O(g) ΔrH° = −36.026 kJ/mol ΔrS° = 446.42 J K−1 mol−1
(2) NH4NO3(s) → N2(g) + ½ O2(g) + 2 H2O(g) ΔrH° = −118.076 kJ/mol ΔrS° = 520.749 J K−1 mol−1
a) Which of the reactions is(are) product-favored at room temperature? Which of the reactions is(are) product-favored at 1000 K? Explain briefly.
b) Is there a temperature below which one of the reactions is more product-favored and above which the other reaction is more product favored? How could you determine this temperature? (Hint: this question can be approached by assuming that all reactants and
Two days before the next whole-class session, this Podia question will become live on Podia, where you can submit your answer.
