
Unit Three
Day 25: Catalysis and Enzymes
As you work through this section, if you find that you need a bit more background material to help you understand the topics at hand, you can consult “Chemistry: The Molecular Science” (5th ed. Moore and Stanitski) Chapter 11-9 and 11-10, and/or Chapter 10.14-10.17 in the Additional Reading Materials section.
D25.1 Homogeneous Catalysts
A homogeneous catalyst is present in the same phase as the reactants. We have already described homogeneous catalysis in Section D24.4.
As an important illustration of homogeneous catalysis, consider Earth’s ozone layer. Ozone in the upper atmosphere, which protects the earth’s surface from ultraviolet radiation, can decompose via the following mechanism:
The presence of nitric oxide, NO, influences the rate of decomposition of ozone via the following catalytic mechanism:
Sum each set of elementary reactions to show that the overall chemical change for the catalyzed mechanism is the same as the uncatalyzed mechanism:
The rate of decomposition of ozone is much greater in the presence of nitric oxide. Certain compounds that contain chlorine also catalyze the decomposition of ozone. These are examples of homogeneous catalysis because all reactants, products, and catalysts are in the same phase—the gas phase.
D25.2 Heterogeneous Catalysts
A heterogeneous catalyst is a catalyst that is present in a different phase from the reactants. Such catalysts are usually solids, and often function by furnishing an active surface upon which one or more steps in the reaction can occur.
Heterogeneous catalysis has at least four steps:
- Adsorption of the reactant(s) onto the surface of the catalyst
- Activation of the adsorbed reactant(s)
- Reaction of the adsorbed reactant(s)
- Diffusion of the product(s) from the surface into the gas or liquid phase (desorption).
Any one of these steps may be slow and thus may serve as the rate determining step. But the overall rate of the reaction is still faster than it would be without the catalyst. Figure 1 illustrates the reaction of alkenes with hydrogen on a nickel catalyst.
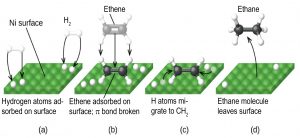
Nickel is the catalyst used in the hydrogenation of polyunsaturated fats and oils to produce saturated fats and oils. Other significant industrial processes that involve the use of heterogeneous catalysts include the preparation of sulfuric acid, the preparation of ammonia, the oxidation of ammonia to nitric acid, and the synthesis of methanol. Heterogeneous catalysts are also used in the catalytic converters found on most gasoline-powered automobiles.
The Chemistry LibreText website provides a thorough, detailed explanation of how catalytic converters work and why they are important.
D25.3 Enzymes
Work through the Enzymes biomolecules tutorial online. Then continue working here. (If tutorial pages are not nicely formatted, adjust the size of your browser window.)
Enzymes, which are usually proteins, can control the rates of chemical reactions between biologically important compounds, particularly those that are involved in cellular metabolism. Different classes of enzymes perform a variety of functions. A few examples are shown in Table 1.
Table 1. Classes of Enzymes and Their Functions
| Class | Type of Reaction Catalyzed |
|---|---|
| oxidoreductases | oxidation-reduction reactions |
| transferases | transfer of functional groups |
| hydrolases | hydrolysis reactions |
| lyases | group elimination to form double bonds |
| isomerases | isomerization |
| ligases | bond formation with ATP hydrolysis |
In a typical enzyme-catalyzed reaction the enzyme and a reactant combine to form a reaction intermediate called an enzyme-substrate complex. (A substrate is a molecule that combines with an enzyme in an enzyme-catalyzed reaction.) Enzymes are very large polymer molecules, so only part of the enzyme molecule can be in contact with the substrate molecule. The part of the enzyme that is in direct contact with a substrate molecule is called the active site.
Two models for how an active site works were discussed in the Enzymes tutorial. The lock-and-key hypothesis suggests that the molecular shapes of the active site and substrate are complementary, fitting together like a key in a lock. The induced fit hypothesis suggests that the enzyme and substrate molecules are flexible and changes shape to accommodate mutual interactions. Both models account for the fact that an enzyme can only bind with specific substrates, since in general a particular enzyme only catalyzes a particular reaction.
When an enzyme-substrate forms the two molecules are held together by intermolecular forces. These attractions distort the substrate molecule, aiding the progress of the reaction. Also, enzymes can act as acids or bases, donating or receiving H+ ions in a way that aids reaction. Thus, the activation-energy barrier for the substrate reaction is lowered by the presence of the enzyme.
If you want more information about enzymes and biological reactions, the Royal Society of Chemistry provides an excellent introduction to enzymes for students and teachers.
D25.4 Enzyme Kinetics
The Michaelis-Menten mechanism is a two-step reaction mechanism followed by many enzyme-catalyzed reactions. An enzyme (E) connects with a substrate (S) to form an enzyme-substrate complex (ES), which then separates to give the product (P) and regenerates the enzyme. The overall reaction is:
with the simple two-step mechanism:
Assign rate constant k1 to the forward reaction in the first step, k−1 to the reverse reaction in the first step, and k2 to the second step. Assume that the second step is rate-limiting. The kinetics of this reaction can then be derived using the steady state approximation, which applies to reactions where the concentration of a highly reactive (i.e. short-lived) intermediate reaches a steady state where it is approximately constant during most of the course of the reaction. In this case, the concentration of the enzyme-substrate complex reaches a steady state:
The enzyme-substrate complex is formed by the forward reaction in the first step and it reacts away in the reverse of the first step and in the second step. Summing the rates of these three processes,
Solving for [ES] gives:
or
where KM is the Michaelis constant,
Given that the enzyme must be either in its unreacted form (E) or combined with substrate (ES), the total concentration of enzyme, [E]total, must be
Substituting into the above equation:
Rearranging the variables:
The reaction rate can be measured by observing the rate of production of the product,
Substituting in the expression for [ES]:
or
where Vmax = k2[E]total is the maximum rate the reaction can achieve.
In the limit that [S] is very large, [S] ≫ KM and therefore [S] + KM ≈ [S], the reaction reaches its maximum rate, rate = Vmax. The reaction rate depends only on the total concentration of enzyme and is independent of the concentration of substrate. This happens when all of the enzyme molecules have a substrate molecule in the active site, which means that increasing the concentration of substrate can no longer increase the concentration of enzyme-substrate complex (and thus increase the rate).
In the limit that [S]≪KM, hence [S] + KM ≈ KM, the reaction is first-order in [S]:
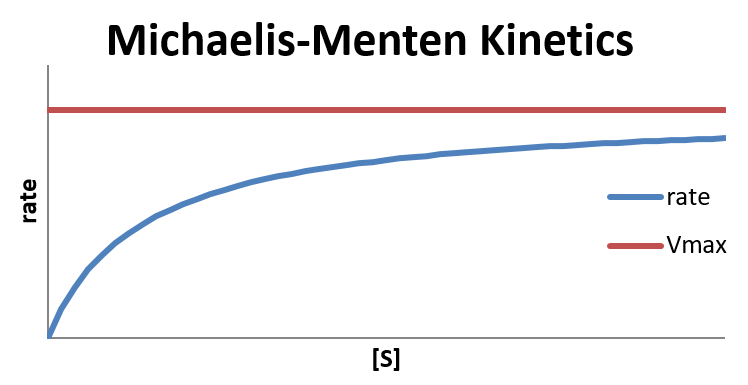
The Michaelis constant is an inverse measure of the substrate’s affinity for the enzyme—a small KM indicates high affinity, meaning that the rate approaches Vmax more quickly. The value of KM depends on both the enzyme and the substrate, as well as conditions such as temperature and pH.
Denaturation is a process in which proteins lose their quaternary, tertiary and secondary structure. Enzymes must be folded into the right shape to function. But hydrogen bonds, which play a big part in folding, are rather weak, and it does not take much heat, acidity, or other stress to break some hydrogen bonds and form others, denaturing the enzyme.
Hence, enzyme-catalyzed reactions exhibit an unusual temperature dependence. At relatively low temperatures, the reaction rate increases with temperature as expected. However, at high temperatures, the reaction rate drops dramatically due to denaturation of the enzyme, as shown in Figure 3.

Usually enzymes do not denature at temperatures typically encountered by the living organism in which they are found; as a result, enzymes from bacteria living in high-temperature environments such as hot springs are prized by industrial users for their ability to function at high temperatures.
Exercise 1: Enzyme Characteristics
An inhibitor (represented by I) interacts with an enzyme to decreases the enzyme’s catalytic efficiency. An irreversible inhibitor covalently binds to the enzyme’s active site, producing a permanent loss in catalytic efficiency even if the inhibitor’s concentration is decreased. A reversible inhibitor forms a noncovalent complex with the enzyme, resulting in a temporary decrease in catalytic efficiency. Removing the inhibitor returns the enzyme’s catalytic efficiency to its normal level.
In competitive inhibition the substrate and the inhibitor compete for the same active site on the enzyme. Because the substrate cannot bind to an enzyme–inhibitor complex, EI, the enzyme’s catalytic efficiency for the substrate decreases. With noncompetitive inhibition the substrate and the inhibitor bind to different active sites on the enzyme, forming an enzyme–substrate–inhibitor, or ESI complex. The formation of an ESI complex decreases catalytic efficiency because only the enzyme–substrate complex reacts to form the product. Finally, in uncompetitive inhibition the inhibitor binds to the enzyme–substrate complex, forming an inactive ESI complex.

Exercise 2: Enzyme Inhibition by Heavy Metals
Some enzymes can be inhibited by heavy metal ions such as Hg2+ or Pb2+. These metal ions have a large affinity for sulfur-containing groups and can react with molecules such as CH3CH2SH. Based on the structures of the amino acids, which amino acid would you expect to be present in enzymes that are inhibited by heavy metals?
Watch this video for an example of how an enzyme works and why understanding enzyme action is important.
Podia Question
Platinum metal is a heterogeneous catalyst for this reaction:
2 NO(g) → N2(g) + O2(g)
The reaction rate varies with concentration of NO as shown in the graph.
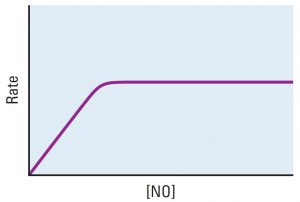
Explain each of these observations. Include in your explanation an atomic-level description of NO molecules, the platinum surface, and how the two interact.
- The graph is linear at low concentrations of NO.
- The graph is horizontal at high concentrations of NO.
Suggest an experiment that could be done to support or contradict your explanation of the horizontal graph.
Two days before the next whole-class session, this Podia question will become live on Podia, where you can submit your answer.
