
Unit One
Day 1: Electromagnetic Radiation and Matter
If you have not yet worked through the Introduction, please do so before beginning this section. As you work through this section, if you find that you need a bit more background material to help you understand the topics at hand, you can consult “Chemistry: The Molecular Science” (5th ed. Moore and Stanitski) Chapter 5 Sections 1 and 2 (Sections 5-1 and 5-2), and/or Chapter 1.1-1.3 in the Additional Reading Materials section. If there are still topics you are confused about, write down your question(s) in your notebook and ask them via Podia or during office hours.
D1.1 Electromagnetic Radiation
An important goal of this course is for you to develop the ability to “invoke models of atoms, molecules, and their interactions to qualitatively explain observed macroscopic phenomena.” Among those phenomena is the organization of the periodic table, which includes the fact that, for elements in a particular column of the table, compounds have similar formulas. For example, the oxides of elements in the second column of the periodic table all have 1:1 atomic ratios: BeO, MgO, CaO, SrO, BaO. There must be something similar about atoms of elements in the second column that leads to their similar behavior when combining with oxygen atoms.
This similarity involves the underlying structure of the atoms in these compounds: how electrons are arranged around atomic nuclei. The first inkling of how electrons are arranged in atoms came from studies of the interaction of light with matter, so we begin by considering light (electromagnetic radiation) and its interactions with atoms and molecules.
Much of modern technology is based on electromagnetic radiation. Radio waves from a mobile phone, X-rays used by dentists, the energy used to cook food in your microwave, the radiant heat from a toaster wire, and the colors emanating from your television screen are forms of electromagnetic radiation. All exhibit behaviors that can be explained by a wave theory.
Activity 1
A wave is an oscillation or periodic movement that can transfer energy from one point to another. For example, the expansion and compression of air that accompanies a lightning strike generates sound waves (thunder) that can travel several miles and cause your ear drums (and sometimes windows) to vibrate. Kinetic energy is transferred through matter (the air) while the matter remains essentially in place. An insightful example of a wave occurs in sports stadiums when fans in a narrow region of seats rise simultaneously and stand with their arms raised for a few seconds before sitting down again and fans in neighboring sections likewise stand up and sit down in sequence. While this wave can quickly encircle a large stadium, none of the fans actually travel with the wave—they all stay in or above their seats.
All waves are characterized by their: wavelength ($latex\lambda$), the distance between two consecutive peaks, troughs, or other equivalent points in a wave; frequency ($latex\nu$), the number of wave cycles (a cycle corresponds to one complete wavelength) that pass a specified point in space in a specified time; and amplitude (A), the magnitude of the wave’s displacement. See examples shown in Figure 1.
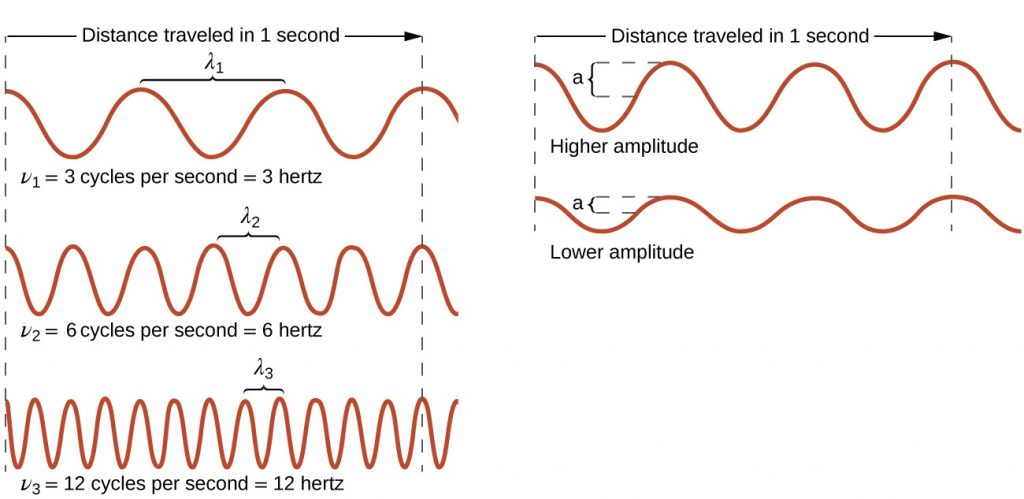
The SI unit for $latex\lambda$ is meter, and for $latex\nu$ is hertz (Hz), which is the number of cycles per second [Hz = $latex\frac{1}{s}$ = s−1]. Common multiples are megahertz, (1 MHz = 1 × 10⁶ Hz) and gigahertz (1 GHz = 1 × 10⁹ Hz). The maximum amplitude of a wave shown in Figure 1 corresponds to one-half the height between the peaks and troughs, and is related to the intensity of the wave. For example, for sound waves, greater amplitude means louder sound.
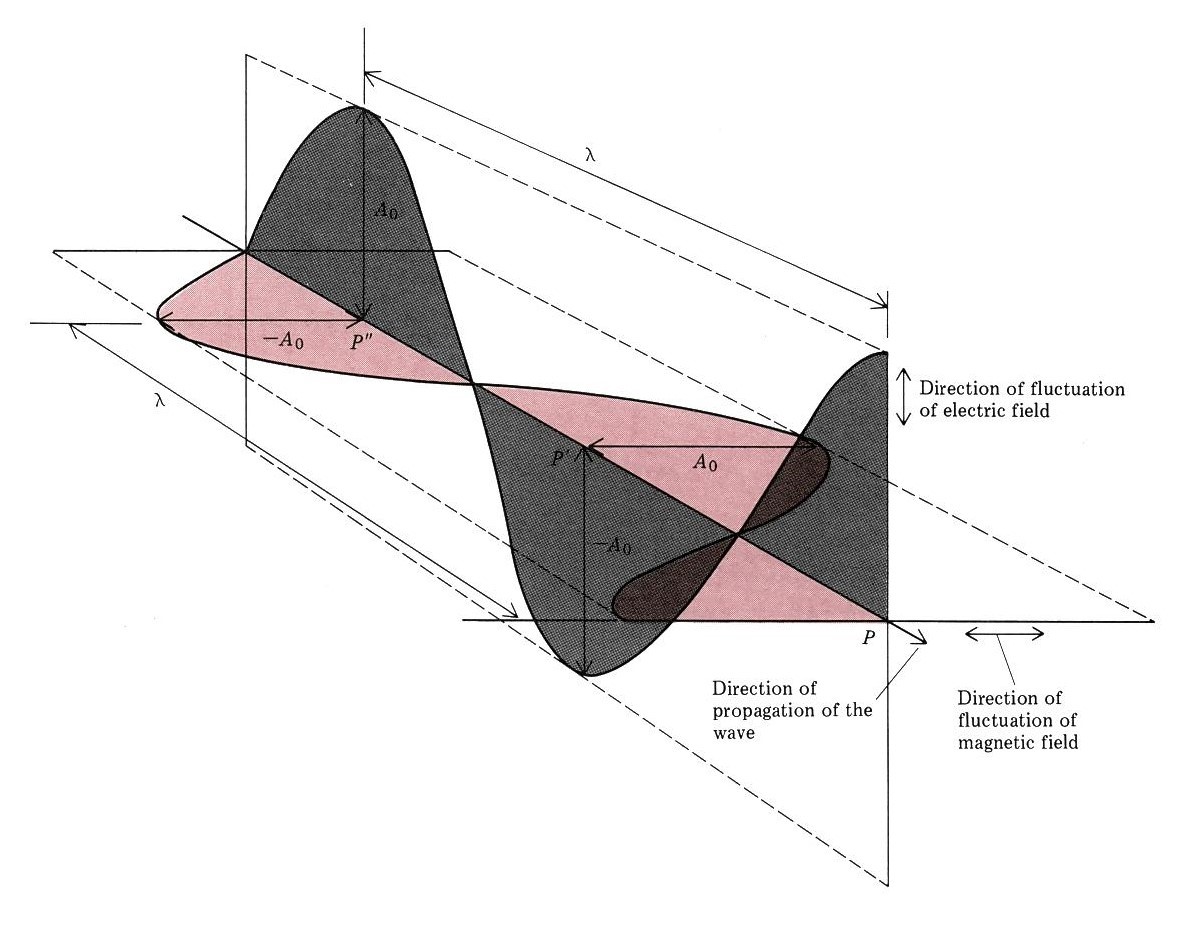
Waves are not restricted to traveling through matter. James Clerk Maxwell proposed the existence of electromagnetic waves, which consist of an electric field oscillating in step with a perpendicular magnetic field, both of which are perpendicular to the direction of travel. These waves can travel through a vacuum at a constant speed of 2.998 × 10⁸ m/s, the speed of light (c).
The product of a wave’s wavelength and its frequency, [latex]\lambda\nu[/latex], is the speed of the wave. (The wave travels distance $latex\lambda$ per cycle and the number of cycles traveled in a given time is [latex]\nu[/latex].) Thus, for electromagnetic radiation in a vacuum:
Because the product [latex]\lambda\nu[/latex] is constant, wavelength and frequency are inversely proportional: as the wavelength increases, the frequency decreases.
Exercise 1: Photons and Laser Light
For all the exercises, before doing any calculation or looking at the hint, write in your class notebook an explanation of how you plan to work out the problem. Do all the steps in the calculation in your notebook. Once you have arrived at an answer, then submit your results below and click the “Check” button to see if it is correct. If one or more parts of your answer is incorrect, go over your work in your notebook carefully and check for errors. “Retry” with your new answer. Look at the hint (click on it to expand for view) only after you have made attempts at answering the question.
Electromagnetic radiation with a wavelength of 0.43 Å can be useful for some medical diagnostics. What is the frequency of this radiation? (an angstroms, Å, is equal to 1 × 10⁻¹⁰ m)
Frequency = [number] × 10[exponent] Hz
Solution: Click the word “solution” to see an explanation of how the result was obtained.
Additional Practice
One of the frequencies used to transmit and receive cellular telephone signals in the United States is 850 MHz. Calculate the wavelength in meters of these radio waves.
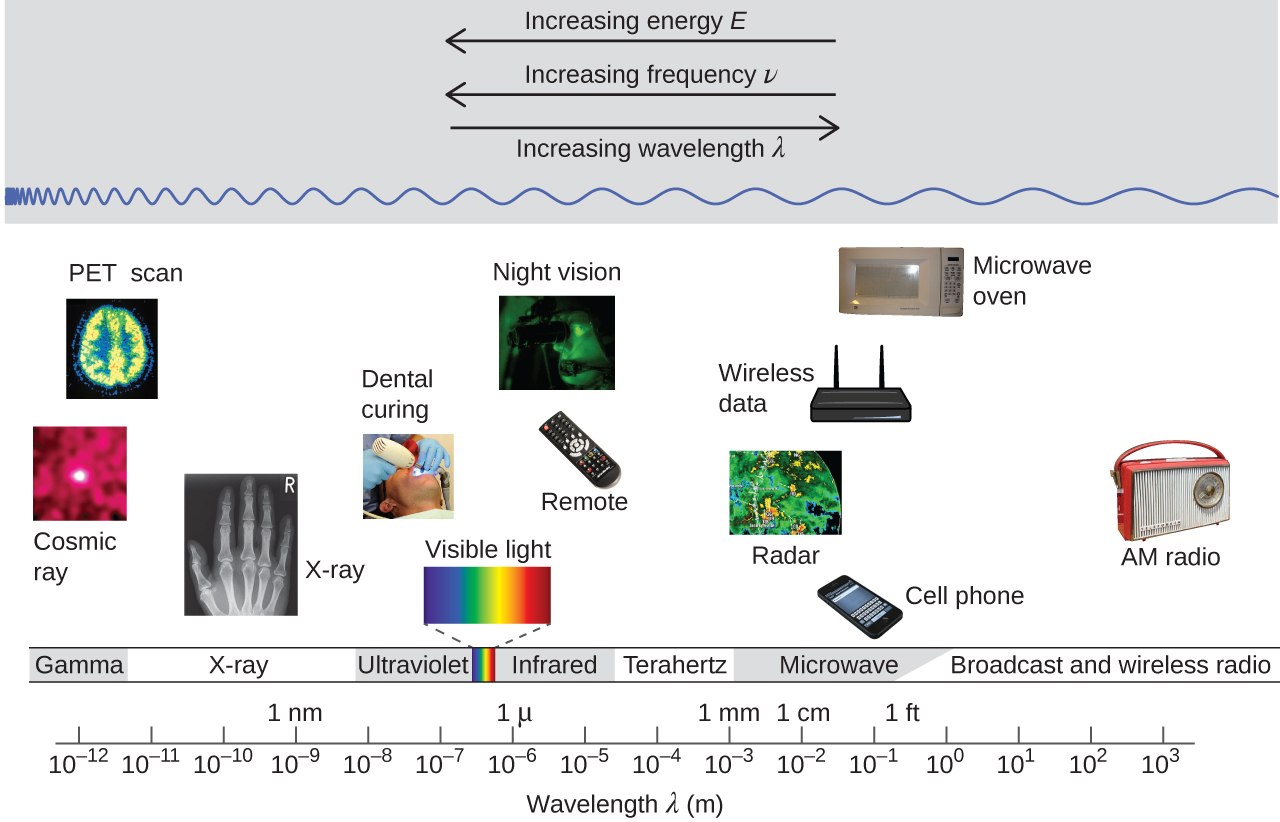
Figure 3 shows the electromagnetic spectrum, the range of all types of electromagnetic radiation. It spans an enormous range—wavelengths of kilometers (103 m) to picometers (10−12 m) have been observed, and the visible-light range makes up only a small portion of it. Given the expansive range of wavelengths, different units are typically used for different parts of the spectrum. For example, radio waves are usually specified as frequencies (typically in units of MHz or GHz), while the visible region is usually specified in wavelengths (typically in units of nm or Å).
D1.2 Wave Properties
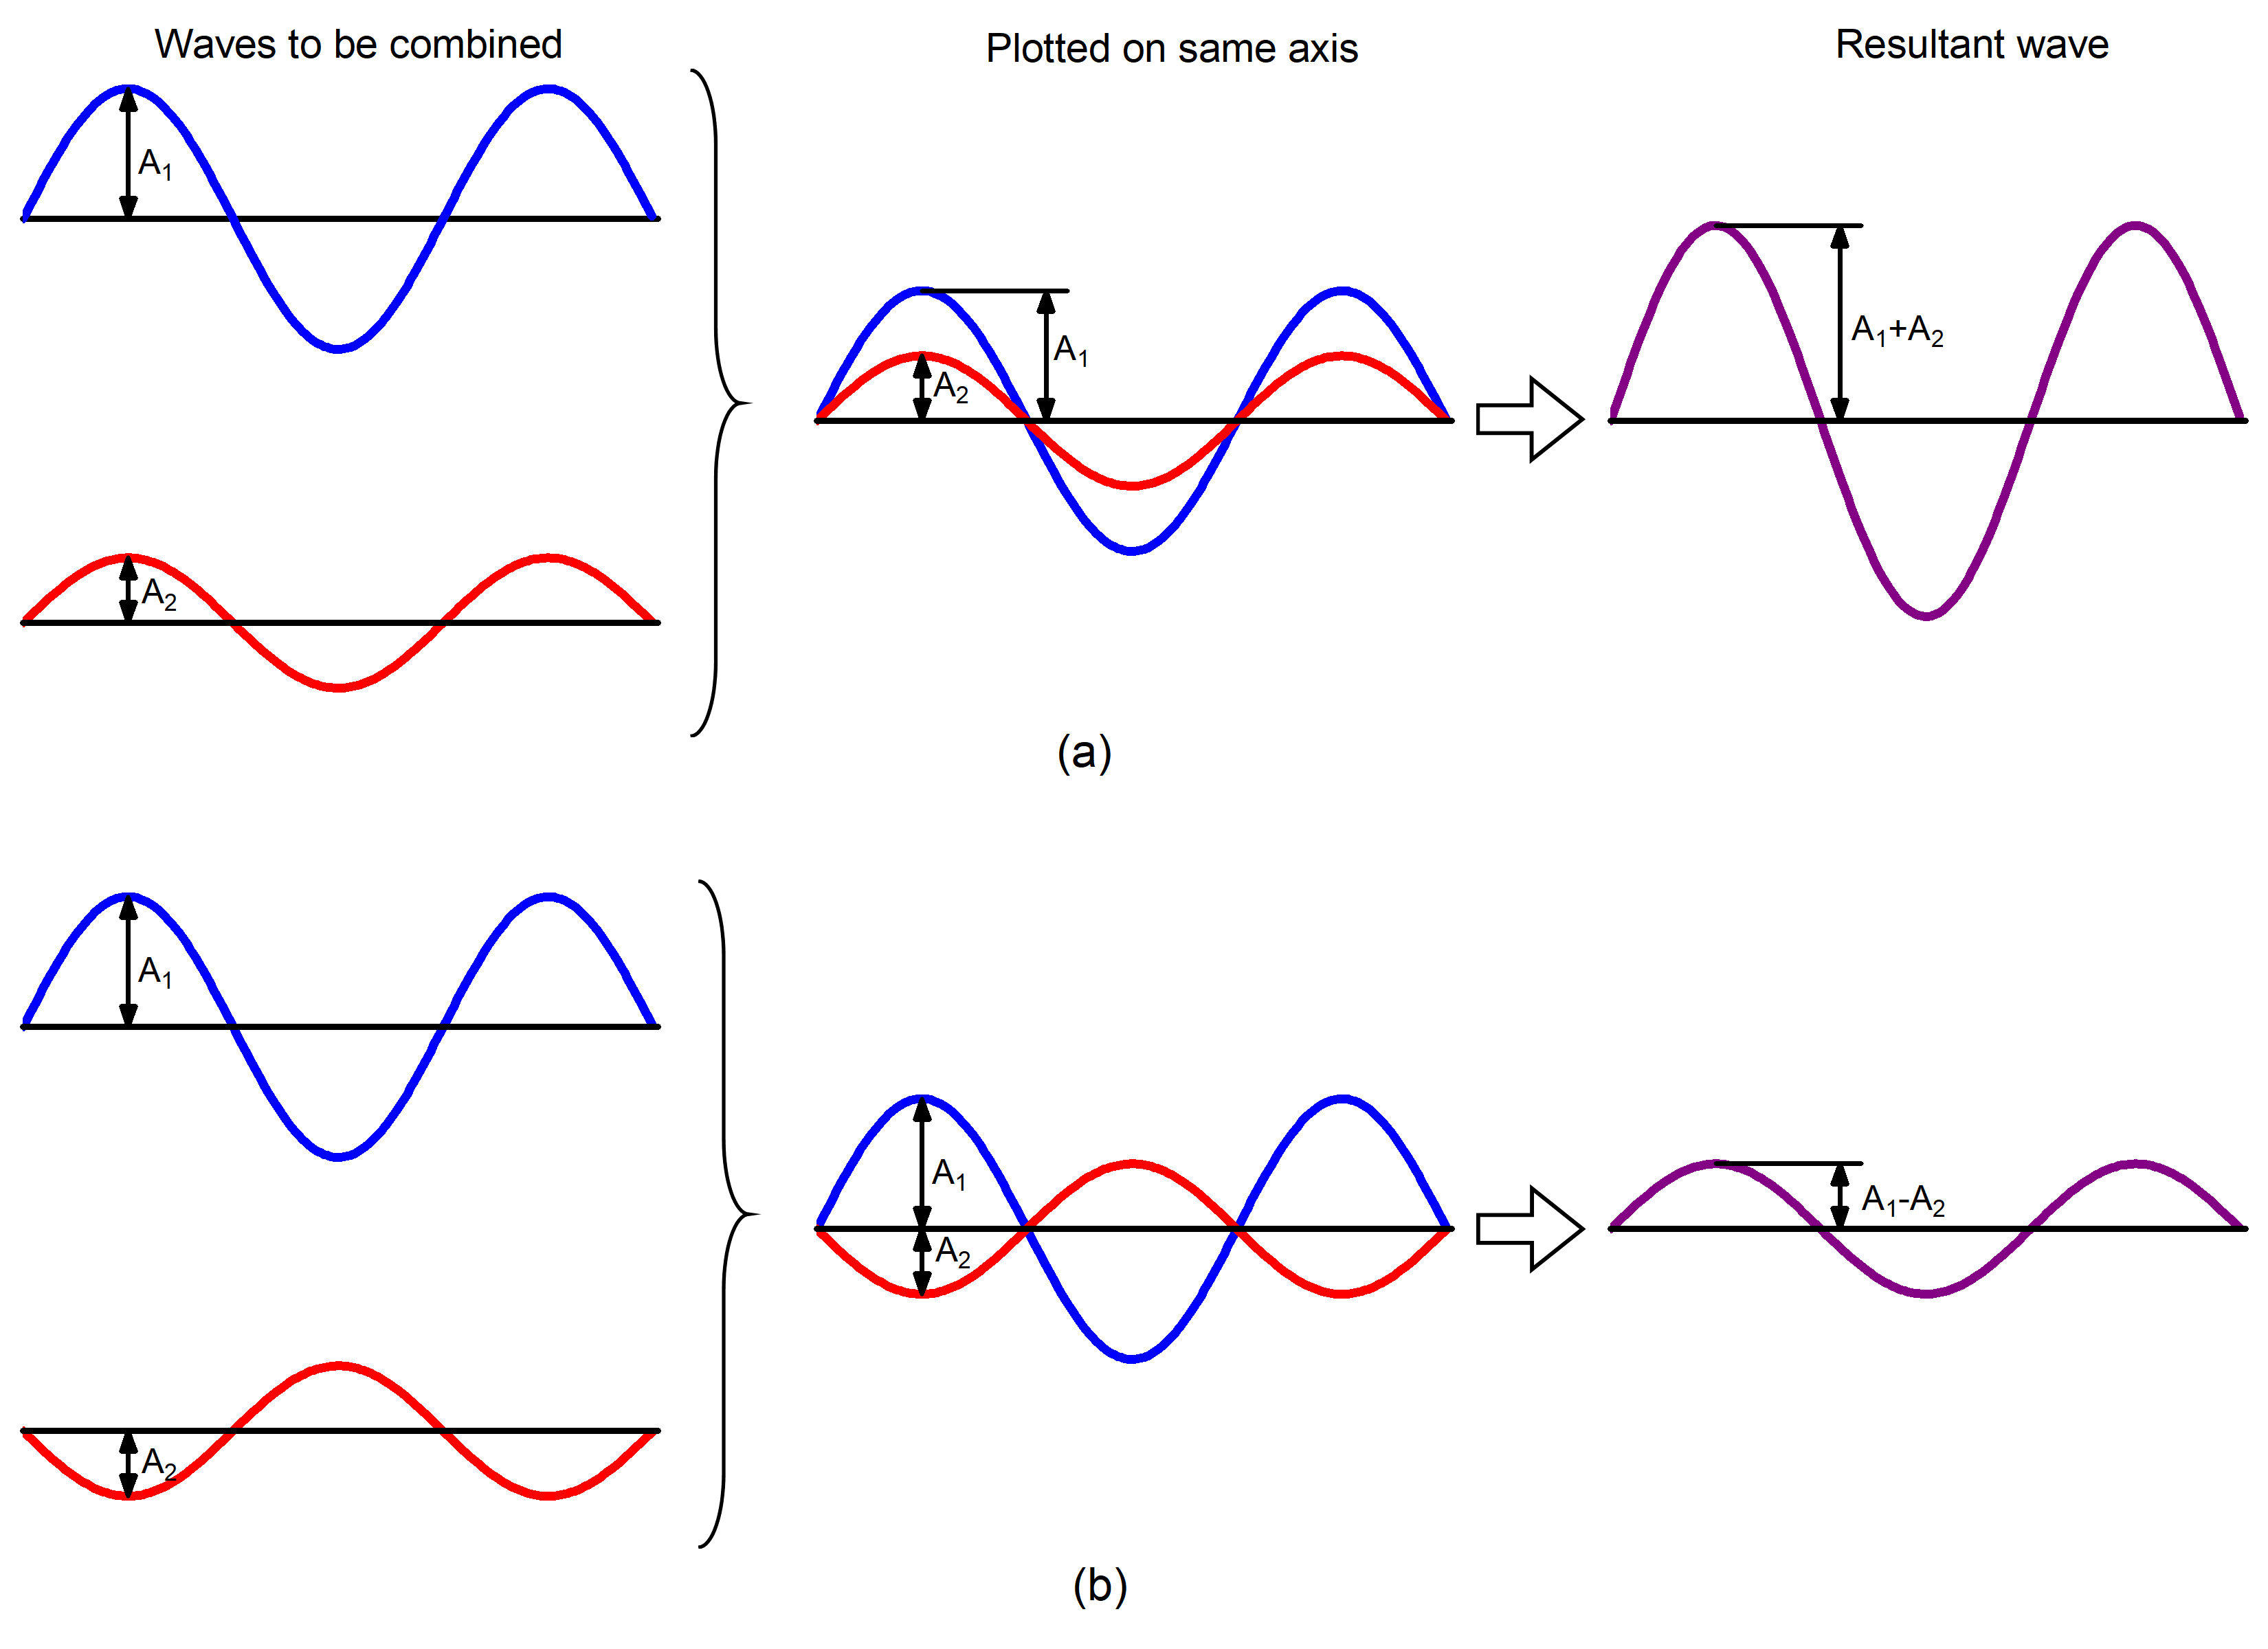
When two or more waves occupy the same region, the total wave amplitude is the sum of the amplitudes of the individual waves. Figure 4 shows that this can result in a larger total amplitude if the amplitudes of the waves have the same mathematical sign (are in phase) or in a smaller total amplitude if the two waves have amplitudes with opposite sign (are out of phase).
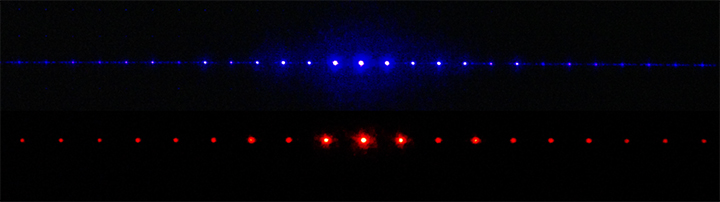
Summation of amplitudes of waves leads to interference of one wave with another. For example, Figure 5 shows the interference patterns that arise when blue or red laser light passes through many narrow slits spaced about one wavelength apart.
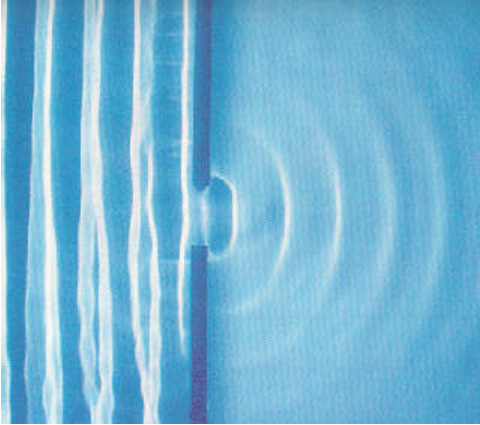 When a wave passes through a pinhole or a very narrow slit, waves fan out on other side of the slit. This is shown on the right for water waves moving from left to right through a hole about the same width as the wavelength.
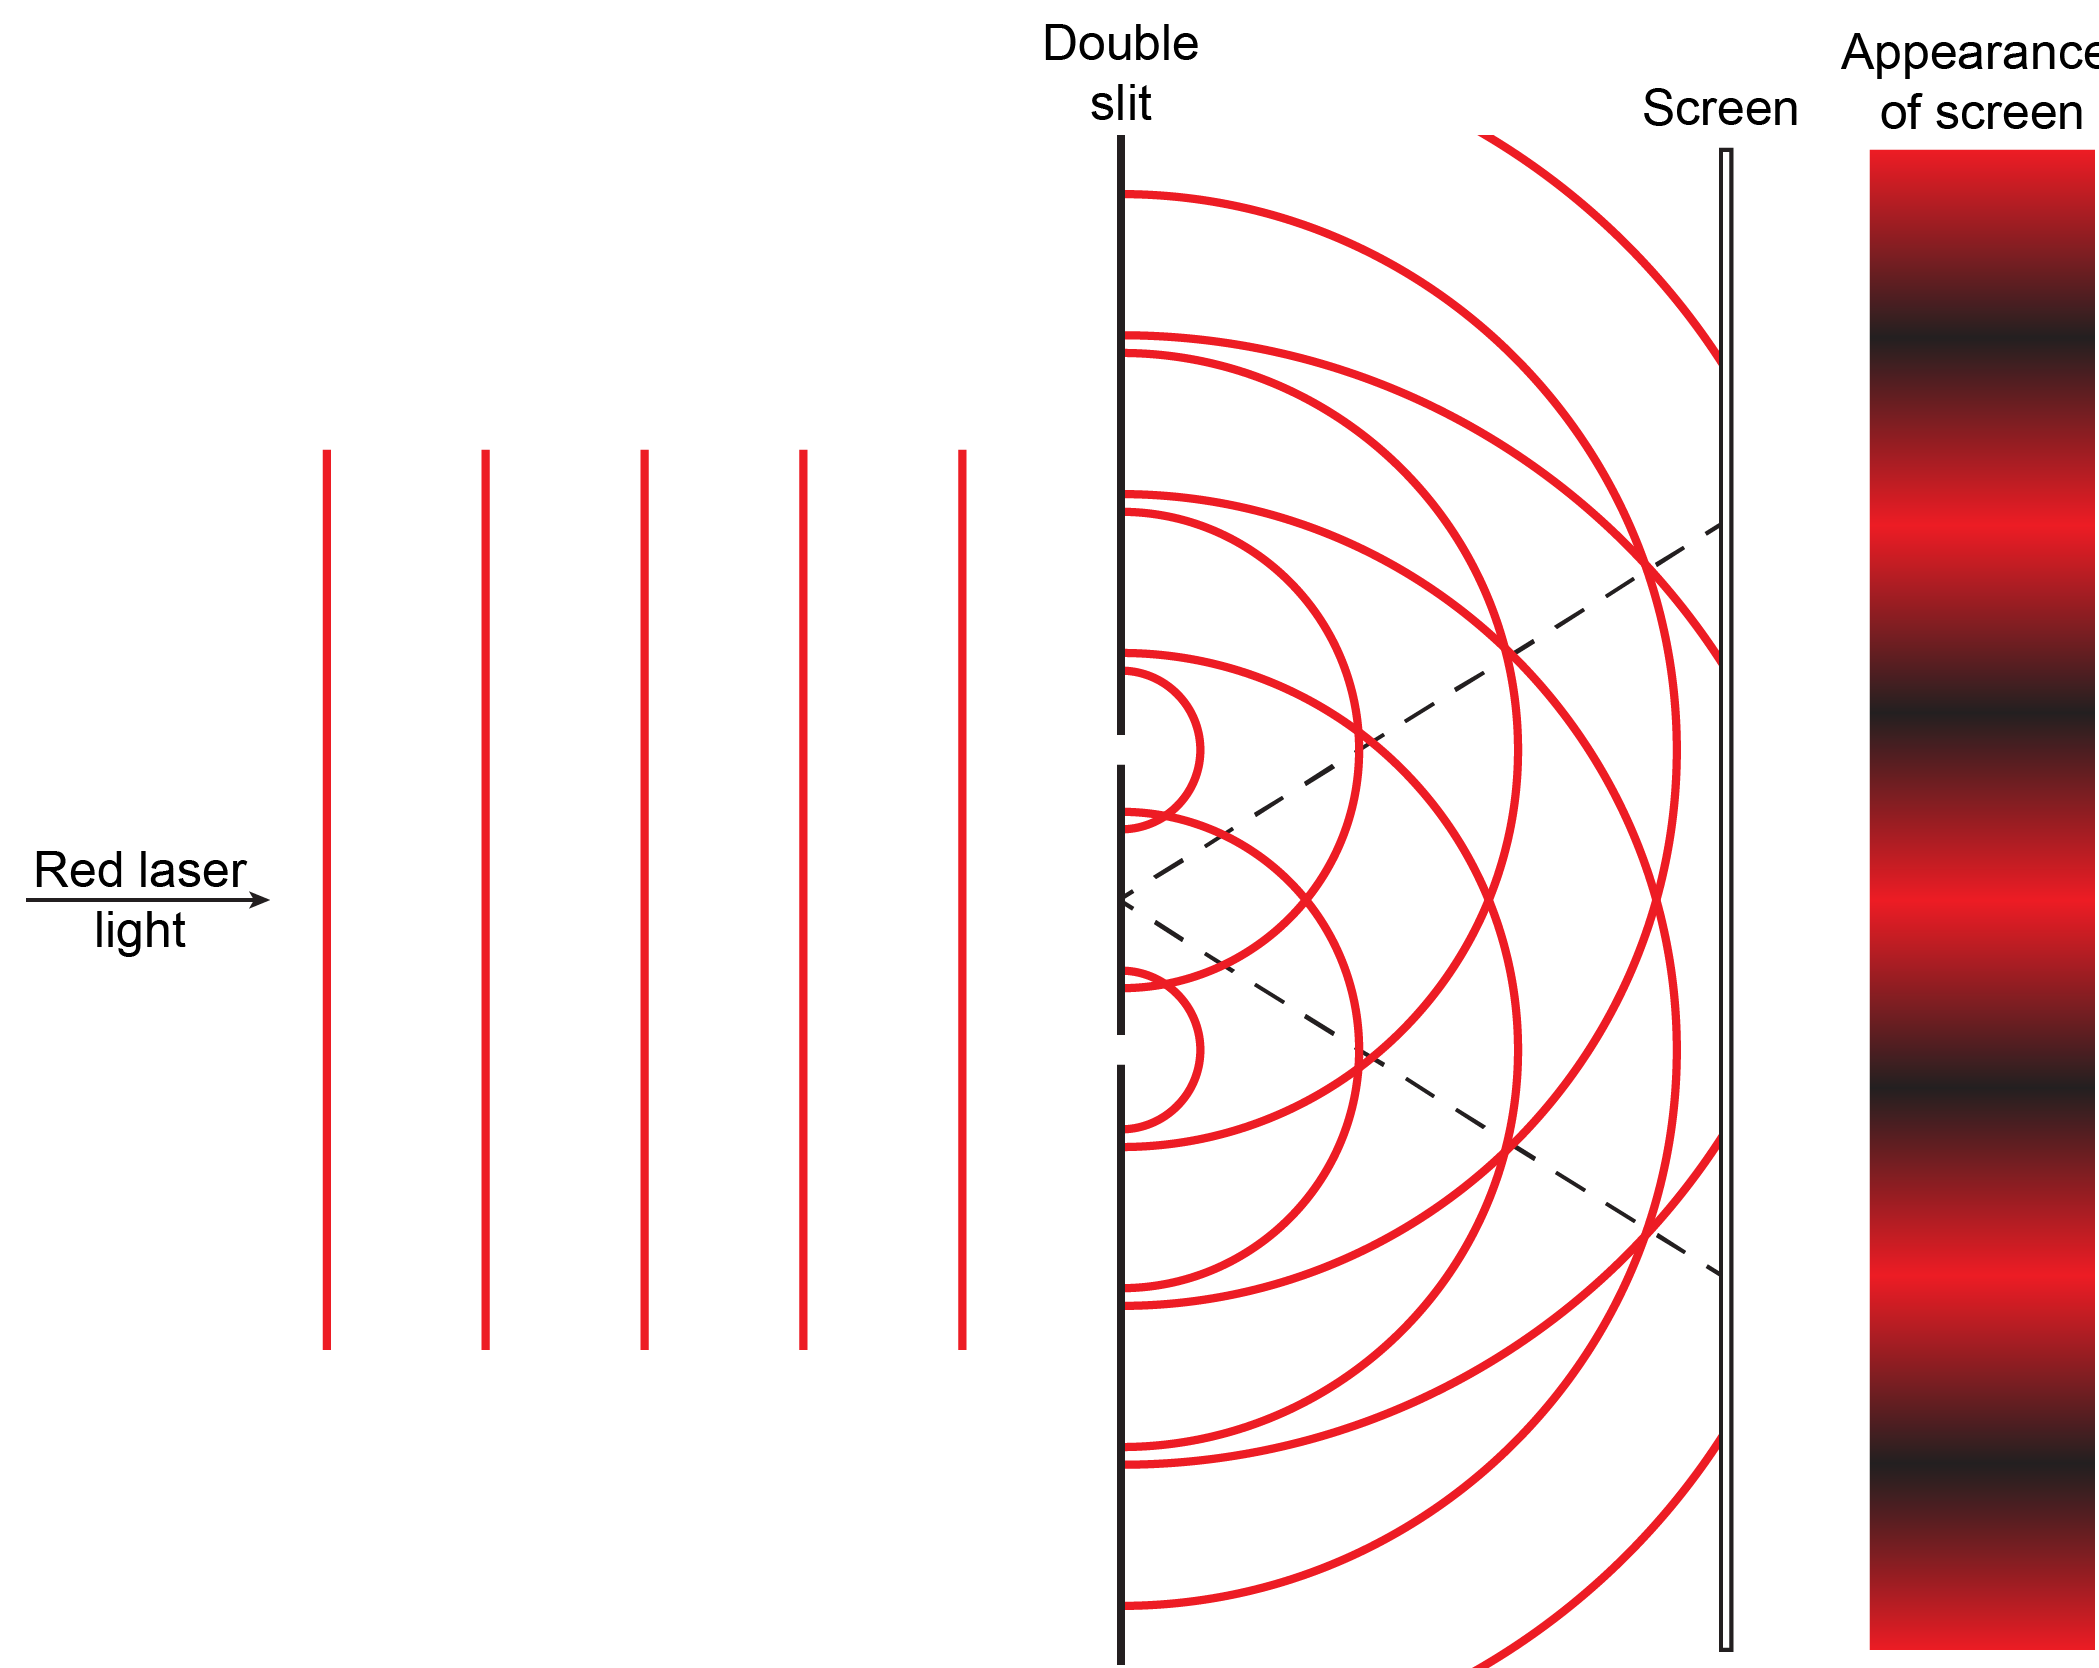
When laser light passes through closely spaced slits, each slit effectively acts as a new source with waves fanning out from it. This results in closely spaced waves coming into contact at the detector (the camera used to make Figure 5). The dark regions in Figure 5 correspond to regions where the peaks for the wave from one slit happen to coincide with the troughs for the wave from the other slit (destructive interference, Fig. 4b), while the brightest regions correspond to regions where the peaks for the two waves (or their two troughs) happen to coincide (constructive interference, Fig. 4a).
Exercise 2: Interference Patterns
Based on what you have just read about summation of waves and interference patterns, write a paragraph that explains to a fellow student the meaning of the figure and how the figure illustrates the origin of interference patterns. If you are studying with another student each should write an explanation and then try it out on the other. Then compare with the result below and make sure each of you understands the explanations.
Result: Do not click the word “result” until you have written an explanation.
Additional Practice 1
Extend your explanation of the figure to account for the closer spacing in the interference pattern for blue light compared to red light. It might be useful to draw another figure.
Additional Practice 2
Suppose that instead of waves, there is a stream of small particles (say, grains of sand or particles of dust) passing through the pair of slits. Assume that the particles are all traveling in exactly the same direction before they hit the double slit. Draw a diagram like the one above to show the pattern on the screen. Explain in words how and why the particle pattern may differ from the wave pattern.
Interference patterns are an inherent property of wave motion but they cannot be explained by particles moving according to the laws of classical mechanics. Particles would move in straight lines through a slit or pinhole and produce a single bright spot.
D1.3 Blackbody Radiation
Have you noticed that some LED light bulbs are a different color from others? Some are “warm” and others are “cool” (see Figure 6). Candlelight is “warmer” (yellower) than fluorescent lights: the latter have a blue cast that can make people’s faces look sickly. These observations are related to blackbody radiation—the continuous spectrum of light emitted by matter as the matter is heated to higher temperatures.
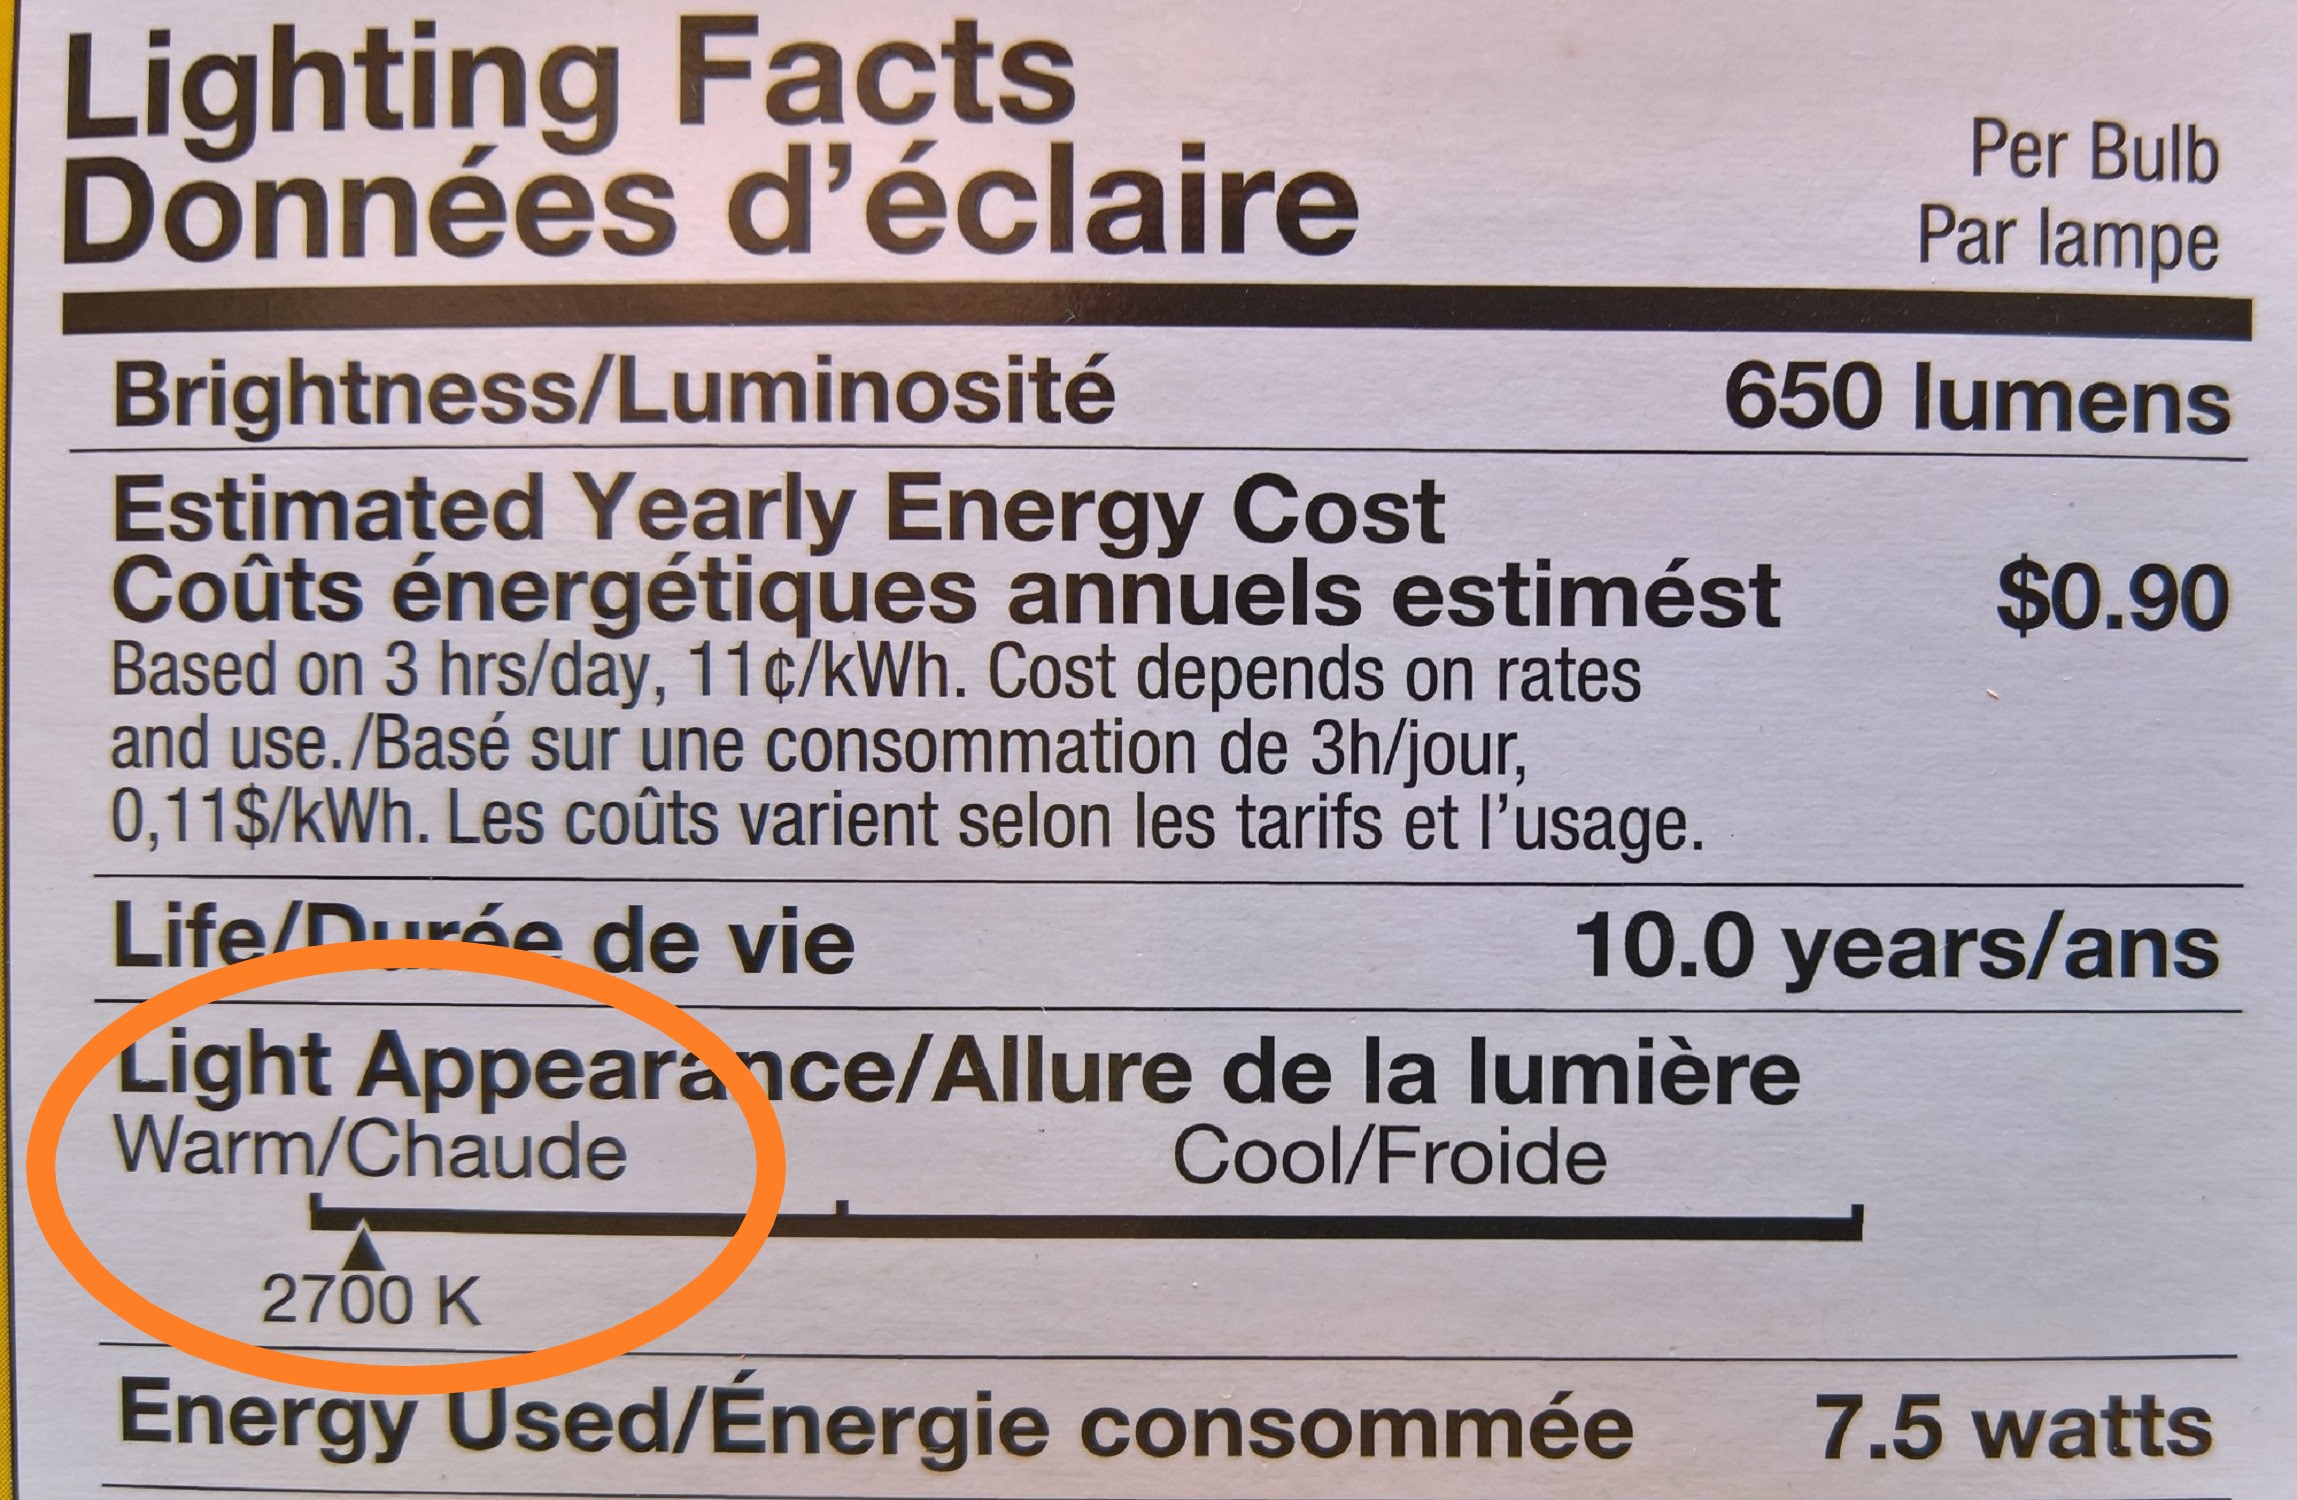
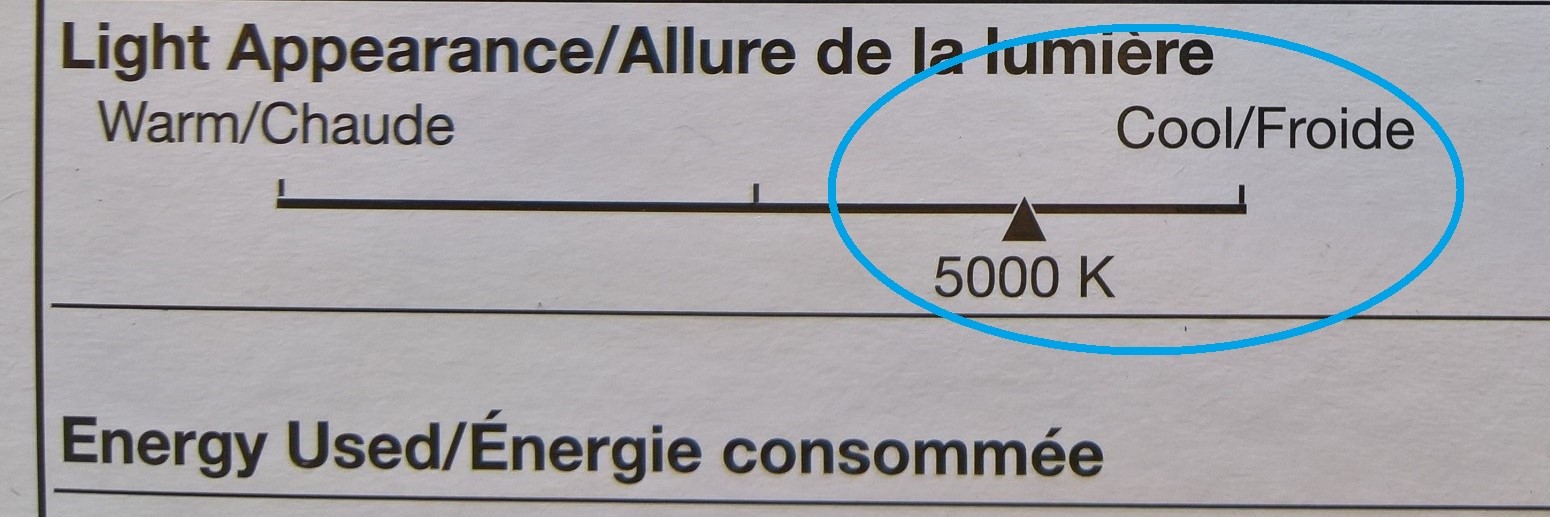 Figure 6. Labels from LED light bulb boxes. Notice that the “warm” bulb is labeled 2700 K while the “cool” bulb is labeled 5000 K.
Figure 7 shows the spectra, graphs of intensity versus wavelength, for blackbody radiation emitted by matter at several different temperatures.
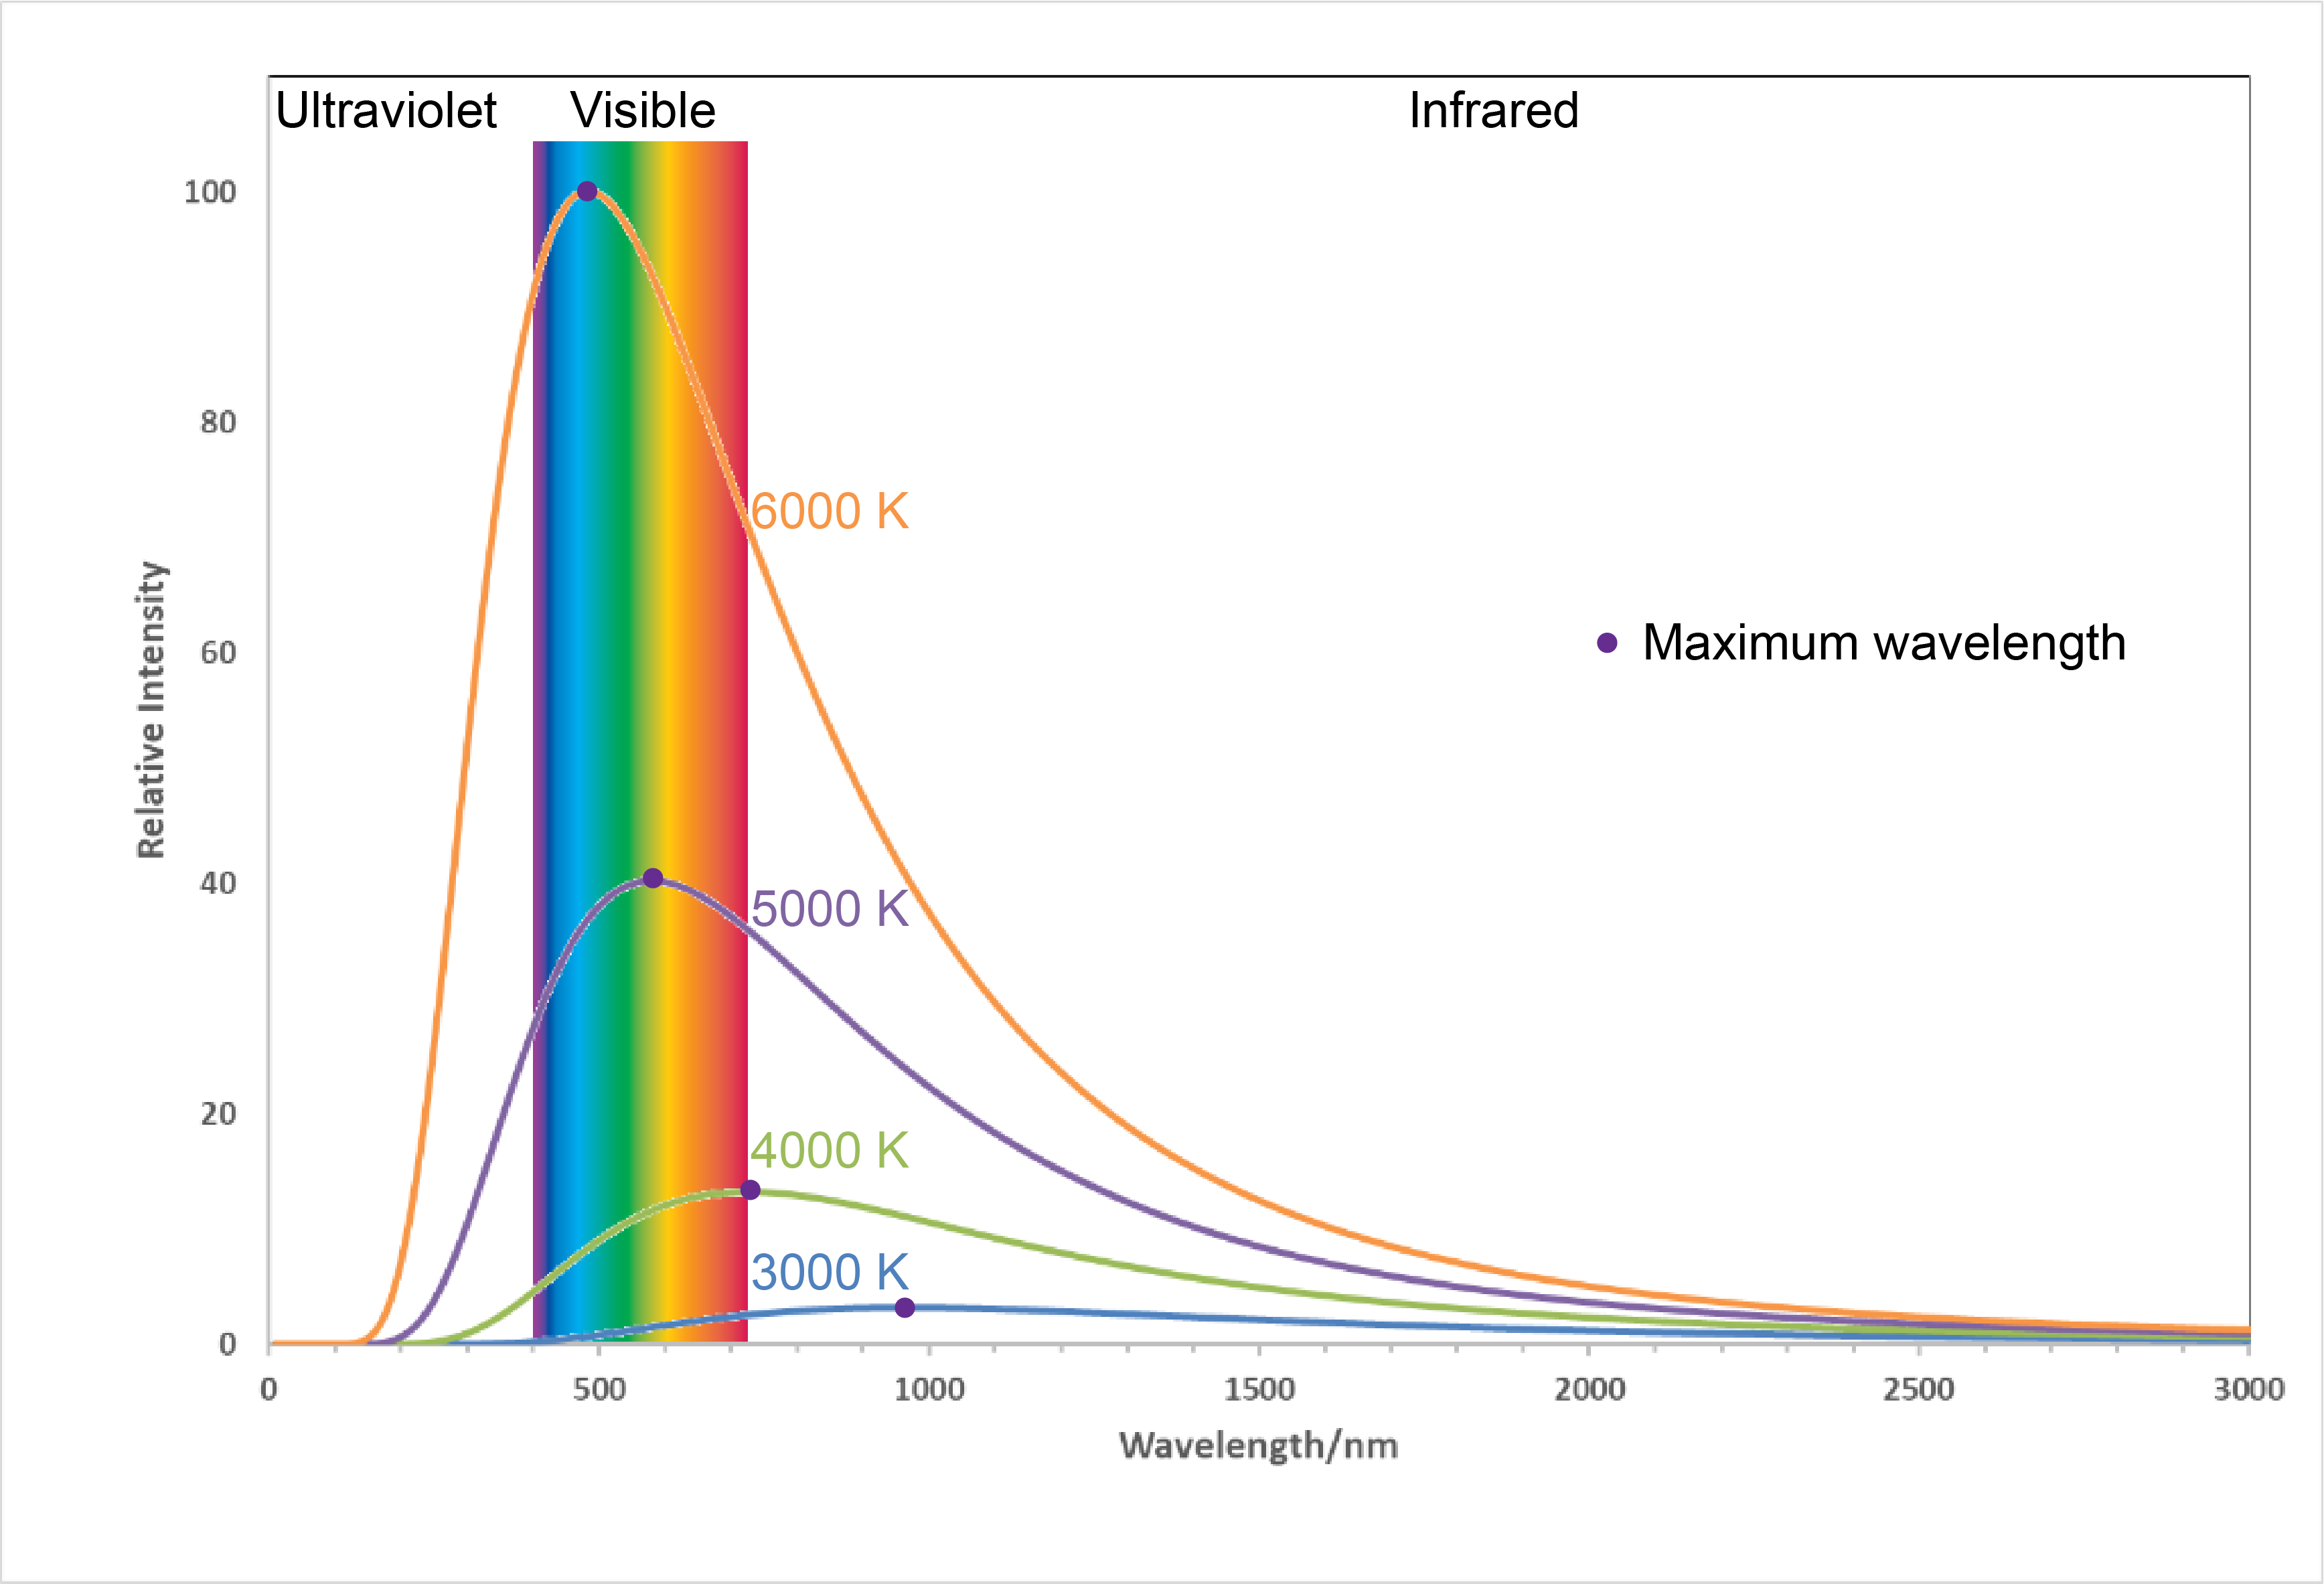
Here, each spectrum depends only on temperature. The wavelength of the maximum in each curve, [latex]\lambda_{\text{max}}[/latex], shifts to shorter wavelengths as the temperature increases. This corresponds to a heated metal first becoming red hot, then brighter and white hot as the temperature increases.
Exercise 3: Interpreting Blackbody Spectra
Additional Practice 1
The temperatures listed in Figure 7 are often referred to as “color temperatures” because different temperatures make an object a different color. Use Figure 7 to predict the color of a blackbody at 4000 K and at 6000 K.

Additional Practice 2
It is reasonable to assume that light from stars is blackbody radiation. This enables astronomers to determine the temperatures of stars based on their spectra. (Spectra enable astronomers to learn lots more about stars than just temperature!) In the constellation Orion, the hunter, the two brightest stars are Betelgeuse and Rigel. Based on the image shown on the right (modification of work by NASA c/o Matthew Spinelli), which star has higher surface temperature? (For an interesting three-minute video of a distant galaxy seen in X-ray, visible, and infrared spectra, follow this link.)
D1.4 Planck’s Quantum Theory
In the late 1800s, physicists derived mathematical expressions for the blackbody curves using well-accepted concepts of mechanics and electromagnetism. They assumed that as the temperature increased the energies of atoms in a metal object would increase as the atoms vibrated more vigorously; these vibrations were assumed to create electromagnetic waves—the blackbody radiation. But no theory based on these ideas was able to predict the shapes of the curves shown in Figure 7. Even worse, the theory predicted that the intensity would become infinitely large for very short wavelengths, an absurd result.
In 1900, Max Planck introduced a revolutionary idea, from which he was able to derive a theoretical expression for blackbody spectra that fit the experimental observations within experimental error. Instead of assuming that the vibrating atoms could have a continuous set of energy values, Planck restricted the vibrational energies to discrete values—that is, he assumed that there must be some minimum quantity of energy that could be transferred between vibrating atoms. That quantity of energy is proportional to the frequency of vibration and is called a quantum.
The proportionality constant “h” is now known as Planck’s constant. Its value is very small, 6.626 × 10⁻³⁴ J·s (joule-seconds). According to Planck’s theory, electromagnetic radiation occurs in small, indivisible quantities (quanta), just as matter consists of small, chemically indivisible quantities (atoms).
Exercise 4: Radiation and Quanta
- Infrared light with wavelength = 1.2 μm Equantum = [number] × 10[exponent] J
- Radio waves with frequency = 89.1 MHz Equantum = [number] × 10[exponent] J
- Green light with wavelength = 525 nm Equantum = [number] × 10[exponent] J
Additional Practice
Although Planck had developed a theory of blackbody radiation that worked, he was not satisfied with the assumption of quantized energies for the vibrating atoms. But not for long—a few years later Albert Einstein used the idea of quantization of electromagnetic radiation to explain another puzzling phenomenon: the photoelectric effect, which is a topic for the next section.
Activity 2
Podia Question
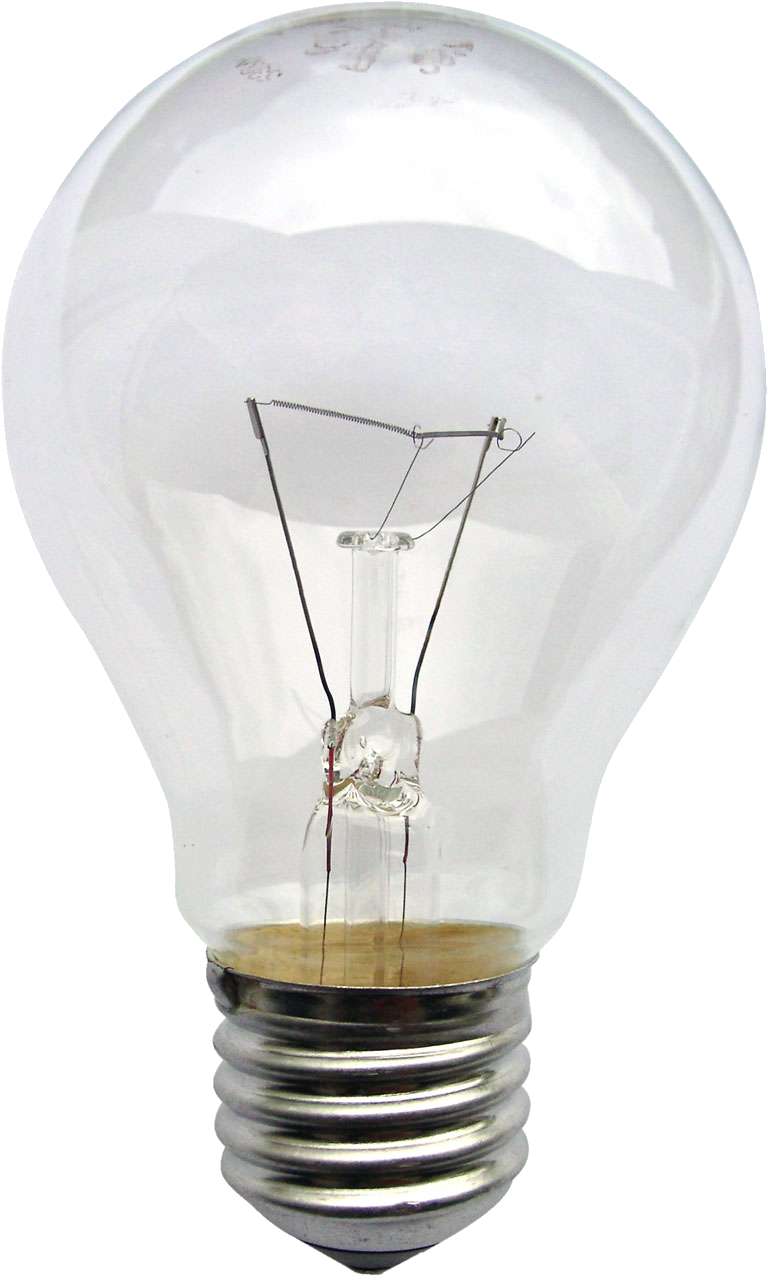
Thomas Edison patented an incandescent light bulb with a carbon filament in 1879. By the early 1900s it became possible to manufacture thin tungsten (symbol W) wires so tungsten filaments replaced carbon. (Like carbon, tungsten has a very high melting point, 3695 K.) Most tungsten light bulbs have efficiencies below 10%—the visible light energy emitted is less than 10% of the electric energy supplied to the bulb. Based on what you have learned in this section, describe one reason why tungsten-filament light bulbs are not more efficient. Use scientifically correct language and be sure your reasoning is clear, logical, and complete.
 In most pre-class assignments we will include a Podia question that may require numerical, text, and/or image-based responses. Consider the problem and write down/draw out your solution in your class notebook.
Two days before the next whole-class session, the Podia question will become live on Podia, where you can submit your solution. [For example, the Podia question in a Wednesday pre-class assignment will open by Monday evening.]
When you come to the next whole-class session, the class leader will choose one or more student-submitted solutions and explain why they are (or are not) effective scientific statements. Podia questions are designed to hone your skills so that you can solve mastery problems you will encounter on exams.
Click on the relevant open Podia question and submit your answer there. Your submission to instructor-opened questions will be anonymous to your classmates, and you can only view your own submission. (If you make a separate post, you will not be anonymous.) For image-based questions, Podia allows you to sketch online and/or take pictures of sketches drawn on paper. To sign into Podia, follow the instructions as shown.
