
Additional Reading Materials
Chapter 10: Reaction Mechanisms
A balanced equation for a chemical reaction indicates what is reacting and what is produced, but it reveals nothing about how the reaction actually takes place. The reaction mechanism (or reaction path) is the process, or pathway, by which a reaction occurs.
Ch10.1 Elementary Reaction
A chemical reaction usually occurs in steps, although it may not always be obvious to an observer. The decomposition of ozone, for example, appears to follow a mechanism with two steps:
We call each step in a reaction mechanism an elementary reaction. Elementary reactions occur exactly as they are written and cannot be broken down into simpler steps. Elementary reactions add up to the overall reaction, which, for the decomposition, is:
Notice that the oxygen atom produced in the first step of this mechanism is consumed in the second step and therefore does not appear as a product in the overall reaction. Species that are produced in one step and consumed in a subsequent step are called intermediates.
While the overall reaction equation for the decomposition of ozone indicates that two molecules of ozone react to give three molecules of oxygen, the mechanism of the reaction does not involve the collision and reaction of two ozone molecules. Rather, it involves a molecule of ozone decomposing to an oxygen molecule and an intermediate oxygen atom; the oxygen atom then reacts with a second ozone molecule to give two oxygen molecules. These two elementary reactions occur exactly as they are shown in the reaction mechanism.
Ch10.2 Unimolecular Elementary Reactions
The molecularity of an elementary reaction is the number of reactant species (atoms, molecules, or ions). For example, a unimolecular reaction involves the rearrangement of a single reactant species to produce one or more molecules of product:
A → products
The rate equation for a unimolecular reaction is:
rate = k[A]
A unimolecular reaction may be one of several elementary reactions in a complex mechanism. For example, the reaction:
O3 → O2 + O
illustrates a unimolecular elementary reaction that occurs as one step of a two-step reaction mechanism. An elementary reaction can also be an overall reaction in some cases. For example, the gas-phase decomposition of cyclobutane, C4H8, to ethylene, C2H4, occurs via a unimolecular, single-step mechanism:
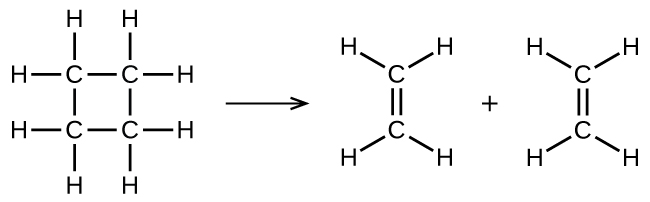
For these unimolecular reactions to occur, all that is required is the separation of parts of single reactant molecules into products.
Chemical bonds do not simply fall apart during chemical reactions. Energy is required to break chemical bonds. The activation energy for the decomposition of C4H8, for example, is 261 kJ/mol. This means that it requires 261 kJ to distort one mole of these molecules into activated complexes that then decompose into products:
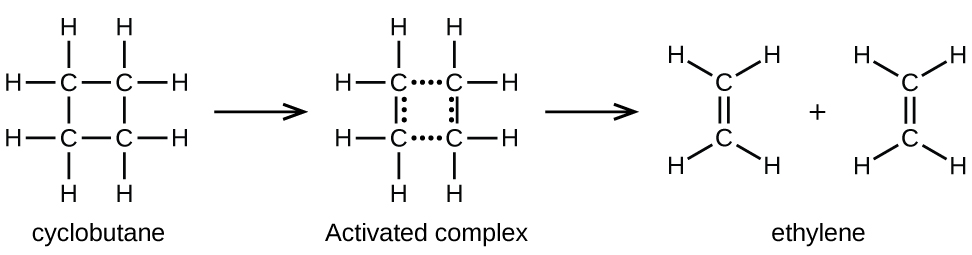
In a sample of C4H8, a rapidly moving C4H8 molecule can collide with other rapidly moving molecules and pick up additional energies. When this C4H8 molecule gains enough energy, it can transform into an activated complex that leads to the formation of ethylene molecules. In effect, energetic collisions can knock a C4H8 molecule into the geometry of the activated complex. However, depending on the temperature, only some fraction of gas molecules travel at sufficiently high speeds with large enough kinetic energies to accomplish this. Hence, at any given moment, only a few molecules pick up enough energy from collisions to react.
The rate of decomposition of C4H8 is directly proportional to its concentration. Doubling the concentration of C4H8 in a sample gives twice as many molecules per liter. Although the fraction of molecules with enough energy to react remains the same, the total number of such molecules is twice as great, and the reaction rate is twice as fast:
A similar relationship applies to any unimolecular elementary reaction; the reaction rate is directly proportional to the concentration of the reactant, and the reaction exhibits first-order behavior. The proportionality constant is the rate constant for the particular unimolecular reaction.
Ch10.3 Bimolecular Elementary Reactions
The collision and combination of two molecules or atoms to form an activated complex in an elementary reaction is called a bimolecular reaction. There are two types of bimolecular elementary reactions:
A + B → products
where the two reactant molecules are different, and the rate law is first-order in A and first order in B:
rate = k[A][B]
and
2A → products
in which two identical molecules collide and react, the rate law is second order in A:
rate = k[A]2
Some chemical reactions have mechanisms that consist of a single bimolecular elementary reaction. One example is the reaction of nitrogen dioxide with carbon monoxide:
NO2(g) + CO(g) → NO(g) + CO2(g)
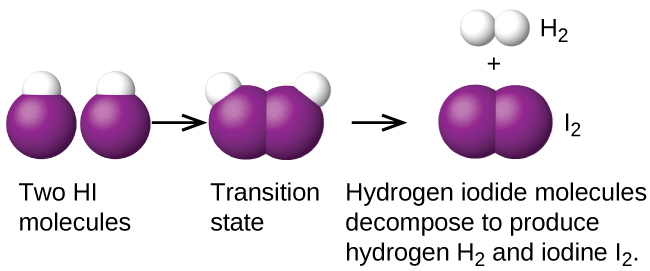
Another is the decomposition of two hydrogen iodide molecules to produce hydrogen, H2, and iodine, I2, Figure 1:
2HI(g) → H2(g) + I2(g)
Bimolecular elementary reactions may also be involved as steps in a multistep reaction mechanism. For example, the reaction of atomic oxygen with ozone is one of the steps in the multistep ozone decomposition reaction:
O(g) + O3(g) → 2O2(g)
Ch10.4 Termolecular Elementary Reactions
An elementary termolecular reaction involves the simultaneous collision of three atoms or molecules. Termolecular elementary reactions rarely occur because the probability of three particles colliding simultaneously is less than 0.1% of the probability of two particles colliding. There are, however, a few established termolecular elementary reactions. The reaction mechanism of nitric oxide with oxygen appears to involve a termolecular step:
2NO(g) + O2(g) → 2NO2(g)
rate = k[NO]2[O2]
Likewise, the reaction of nitric oxide with chlorine appears to involve a termolecular step:
2NO(g) + Cl2(g) → 2NOCl(g)
rate = k[NO]2[Cl2]
Ch10.5 Collision Theory
We should not be surprised that atoms, molecules, or ions must collide before they can react with each other. Atoms must be close together to form chemical bonds. This simple premise is the basis for a very powerful theory that explains many observations regarding chemical kinetics, including factors affecting reaction rates.
Collision theory is based on the following postulates:
- The rate of a reaction is proportional to the rate of reactant collisions:
[latex]\text{reaction\;rate}\;{\propto}\;\frac{\#\;\text{collisions}}{\text{time}}[/latex]
- The reacting species must collide in an orientation that allows contact between the atoms that will become bonded together in the product.
- The collision must occur with adequate energy so that the electrons can rearrange and form new bonds (and new chemical species).
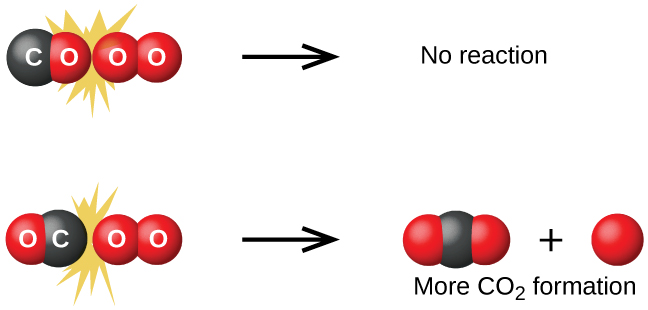
We can see the importance of postulates 2 when we consider the reaction of carbon monoxide with oxygen:
2CO(g) + O2(g) → 2CO2(g)
Carbon monoxide is a pollutant produced by the combustion of hydrocarbon fuels. To reduce this pollutant, automobiles have catalytic converters that use a catalyst to carry out this reaction. It is also a side reaction of the combustion of gunpowder that results in muzzle flash for many firearms. If carbon monoxide and oxygen are present in sufficient quantity, the reaction is spontaneous at high temperature and pressure.
The first step in this reaction is a collision between two molecules:
CO(g) + O2(g) → CO2(g) + O(g)
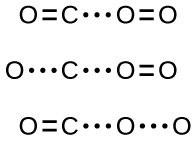
Although there are many different possible orientations the two molecules can have relative to each other, consider the two presented in Figure 2: In case (1), the oxygen side of the CO molecule collides with the O2 molecule; in case (2), the carbon side of the CO molecule collides with O2. Case (2) is clearly more likely to result in the formation of a CO2 molecule, which has a central carbon atom bonded to two oxygen atoms (O=C=O). This is a simple example of how important molecular orientations are in terms of creating the desired product.
Collision theory also explains why most reaction rates increase as concentrations increase. With an increase in the concentration of any reacting substance, the chances for collisions between molecules are increased because there are more molecules per unit of volume. More collisions mean a faster reaction rate, assuming the energy of the collisions is adequate.
Ch10.6 Transition State
We used to example of the first step in the gas-phase reaction between CO and O2 (2CO(g) + O2(g) → 2CO2(g)) to illustrate the importance of the orientation of the collision in terms of creating the desired product.
CO(g) + O2(g) → CO2(g) + O(g)
However, even if the collision does take place with the proper orientation, there is still no guarantee that this bimolecular reaction step will proceed to form CO2. Every reaction requires a certain amount of activation energy for it to proceed in the forward direction, yielding an appropriate activated complex along the way. As Figure 3 demonstrates, even a collision with the correct orientation can fail to form the reaction product. In the study of reaction mechanisms, each of these three arrangements of atoms is called a proposed activated complex or transition state.
In most circumstances, it is impossible to isolate or identify a transition state or activated complex. For the above example, activated complexes have only been observed spectroscopically in systems that utilize a heterogeneous catalyst. The gas-phase reaction occurs too rapidly to isolate any such chemical compound.
Ch10.7 Activation Energy and the Arrhenius Equation
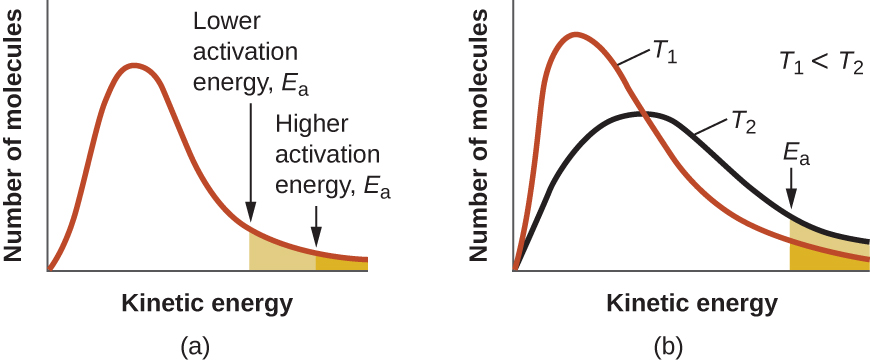
The minimum energy necessary to form a product during a collision between reactants is called the activation energy (Ea). The kinetic energy of reactant molecules plays an important role in a reaction because the energy necessary to form a product is provided by a collision of a reactant molecule with another reactant molecule. (In single-reactant reactions, activation energy may be provided by a collision of the reactant molecule with the wall of the reaction vessel or with inert molecules.) If the activation energy is much larger than the average kinetic energy of the molecules, the reaction will occur slowly—only a few fast-moving molecules will have enough energy to react. If the activation energy is much smaller than the average kinetic energy of the molecules, the fraction of molecules possessing the necessary kinetic energy will be large—most collisions between molecules will result in reaction, and the reaction will occur rapidly.
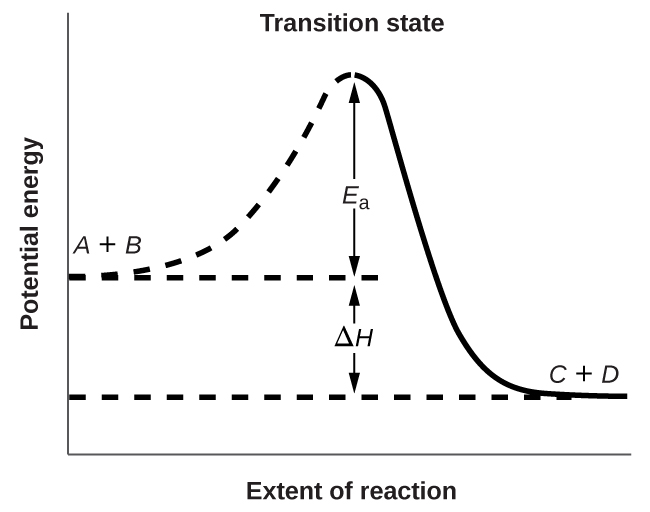
Figure 4 shows the energy relationships for the general reaction:
A + B → C + D
The energy of the transition state is higher than that of the reactants A and B by an amount equal to Ea, the activation energy. Thus, the sum of the kinetic energies of an A molecule and a B molecule must be equal to or greater than Ea to reach the transition state. After the transition state has been reached, and as C and D begin to form, the system releases energy until its total energy is lower than that of the initial mixture. This lost energy is transferred to other molecules, giving them enough energy to reach the transition state. In Figure 4, ΔH represents the difference in enthalpy between the reactants (A and B) and the products (C and D). Hence, the sum of Ea and ΔH represents the activation energy for the reverse reaction:
C + D → A + B
We can use the Arrhenius equation to relate the activation energy and the rate constant, k, of a given reaction:
In this equation, R is the ideal gas constant, which has a value of 8.314 [latex]\frac{J}{mol*K}[/latex], T is temperature on the Kelvin scale, and Ea is the activation energy in J/mol. The constant A is the frequency factor, or prefactor, which is related to the rate at which collisions having the correct orientation occur. The overall exponential term, [latex]e^{-E_a/RT}[/latex], is related to the fraction of collisions providing adequate energy to overcome the activation barrier of the reaction.
At one extreme, the system does not contain enough energy for collisions to overcome the activation barrier. In such cases, no reaction occurs. At the other extreme, the system has so much energy that every collision with the correct orientation can overcome the activation barrier, causing the reaction to proceed nearly instantaneously.
The Arrhenius equation describes quantitatively much of what we have already discussed about reaction rates. For two reactions at the same temperature, the reaction with the higher activation energy has the lower rate constant and hence the slower rate. (A larger Ea results in a smaller value for [latex]e^{-E_a/RT}[/latex], reflecting the smaller fraction of molecules with enough energy to react, which leads to a smaller rate constant.) The rate constant is also directly proportional to the frequency factor, A. Hence a change in conditions or reactants that increases the number of collisions with a favorable orientation for reaction results in an increase in A and, consequently, an increase in k.
Ch10.8 Effect of Temperature
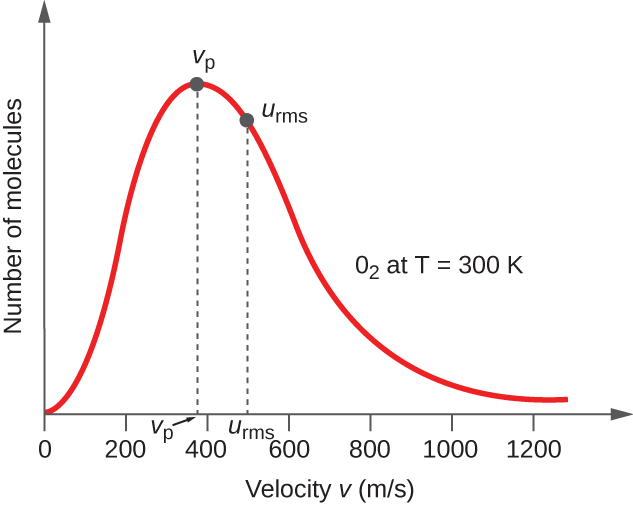
In a gas sample, individual molecules have widely varying speeds; however, because of the vast number of molecules and collisions involved, the molecular speed distribution and average speed are constant. This molecular speed distribution is known as a Maxwell-Boltzmann distribution, and it depicts the relative numbers of molecules in a bulk sample of gas that possesses a given speed (Figure 5).
The average kinetic energy, KEavg, is then equal to:
The KEavg of a collection of gas molecules is also directly proportional to the temperature of the gas and may be described by the equation:
where R is the gas constant and T is the kelvin temperature. When used in this equation, the appropriate form of the gas constant is 8.314 J/K (8.314 kg m2s–2K–1).
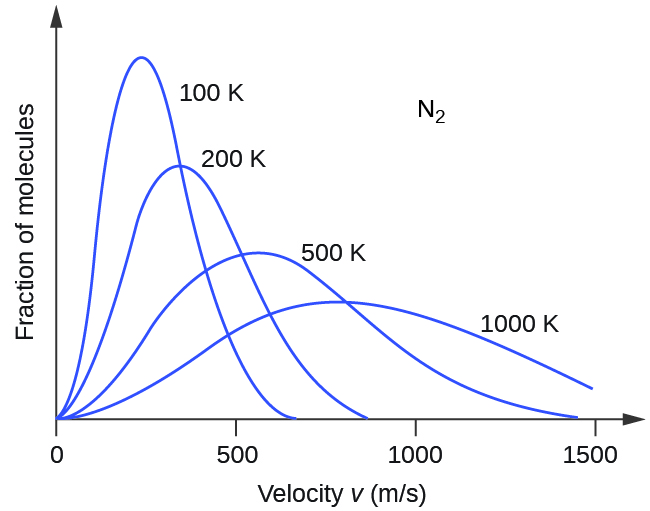
If the temperature of a gas increases, its KEavg increases, more molecules have higher speeds and fewer molecules have lower speeds, and the distribution shifts toward higher speeds overall, that is, to the right. If temperature decreases, KEavg decreases, more molecules have lower speeds and fewer molecules have higher speeds, and the distribution shifts toward lower speeds overall, that is, to the left. This behavior is illustrated for nitrogen gas in Figure 6.
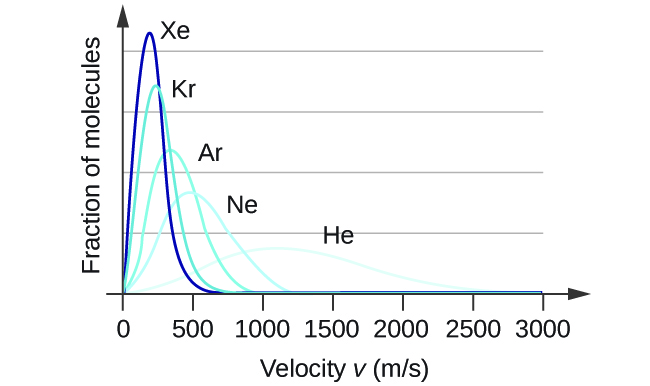
At a given temperature, all gases have the same KEavg for their molecules. Gases composed of lighter molecules have more high-speed particles and a higher urms, with a speed distribution that peaks at relatively higher velocities. Gases consisting of heavier molecules have more low-speed particles, a lower urms, and a speed distribution that peaks at relatively lower velocities. This trend is demonstrated by the data for a series of noble gases shown in Figure 7.
An increase in temperature has a similar effect as a decrease in activation energy, as shown in Figure 8. At a given temperature, a sample of molecules have a distribution of kinetic energies described by the Maxwell-Boltzmann distribution, and some fraction of the molecules would have kinetic energies higher than the reaction’s Ea. Therefore, at a higher temperature, a larger fraction of molecules would have the necessary energy to react, as indicated by an increase in the value of [latex]e^{-E_a/RT}[/latex].
Ch10.9 Arrhenius Plot
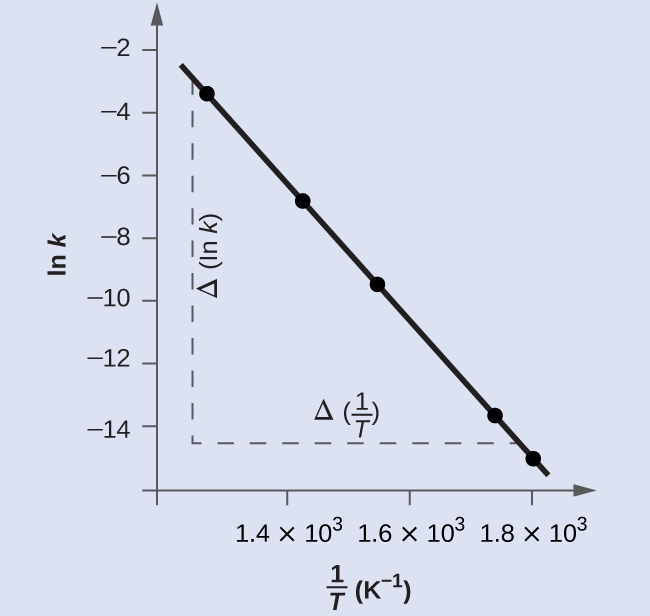
A convenient approach to determining Ea for a reaction involves the measurement of k at different temperatures and using an alternate version of the Arrhenius equation that takes the form of linear equation:
Thus, a plot of ln(k) versus [latex]\frac{1}{T}[/latex] gives a straight line where [latex]slope=\frac{-E_a}{R}[/latex], from which Ea may be determined. The intercept gives the value of ln(A).
Example 1
Determination of Ea
The variation of the rate constant with temperature for the decomposition of HI:
2HI(g) → H2(g) + I2(g)
is given here. What is the activation energy for the reaction?
| T (K) | k (M-1s-1) |
|---|---|
| 555 | 3.52 × 10⁻⁷ |
| 575 | 1.22 × 10⁻⁶ |
| 645 | 8.59 × 10⁻⁵ |
| 700 | 1.16 × 10⁻³ |
| 781 | 3.95 × 10⁻² |
Solution
Values of [latex]\frac{1}{T}[/latex] and ln(k) are:
| [latex]\frac{1}{T}\;(K^{-1})[/latex] | ln k |
|---|---|
| 1.80 × 10⁻³ | −14.860 |
| 1.74 × 10⁻³ | −13.617 |
| 1.55 × 10⁻³ | −9.362 |
| 1.43 × 10⁻³ | −6.759 |
| 1.28 × 10⁻³ | −3.231 |
Figure 9 is a graph of ln(k) versus [latex]\frac{1}{T}[/latex]. A linear fit of the data gives:
slope = -2.23×10⁴ K.
To determine the activation energy:
It is possible to obtain a reasonable estimate of the activation energy without going through the entire process of constructing the Arrhenius plot. The slope of the plot is
[latex]\text{Slope} = \frac{{\Delta}(\text{ln}\;k)}{{\Delta}(\frac{1}{T})} = -\frac{E_{\text{a}}}{R}[/latex]
The Arrhenius equation:
can therefore take the form (by subtracting the Arrhenius equation with k2 and T2 from the Arrhenius equation with k1 and T1):
or
or
Using the experimental data presented here, we can simply select two data entries, for example, the first entry and the last entry:
| T (K) | k (M-1s-1) |
|---|---|
| 555 | 3.52 × 10⁻⁷ |
| 781 | 3.95 × 10⁻² |
and substitute into the equation:
This method works well especially when a limited number of temperature-dependent rate constants are available for the reaction of interest.
Check Your Learning
The rate constant for the rate of decomposition of N2O5 to NO and O2 in the gas phase:
2N2O5(g) → 4NO(g) + 3O2(g)
is 1.66 M-1s-1 at 650. K and 7.39 M-1s-1 at 700. K. Assuming the kinetics of this reaction are consistent with the Arrhenius equation, calculate the activation energy for this decomposition.
Answer:
1.13×10⁵ J/mol
Ch10.10 Relating Reaction Mechanisms to Rate Laws
It’s often the case that one step in a multistep reaction mechanism is significantly slower than the others. Because a reaction cannot proceed faster than its slowest step, this step will limit the rate at which the overall reaction occurs. The slowest step is therefore called the rate-determining step (or rate-limiting step) of the reaction Figure 10.

For elementary reactions, rate laws (and reaction order) can be derived directly from the stoichiometry of the chemical equations. This is not the case, however, for multistep reactions where the balanced equations represent the overall change for the chemical system. In such a case, we must determine the overall rate law from experimental data and deduce the mechanism from the rate law (and sometimes from other data).
Ch10.11 Rate-Determining Step is the First Step in a Multistep Reaction
The reaction of NO2 and CO provides an illustrative example:
NO2(g) + CO(g) → CO2(g) + NO(g)
For temperatures above 225 °C, the rate law has been found to be:
rate = k[NO2][CO]
where the reaction is first order with respect to NO2 and first-order with respect to CO. This is consistent with a single-step bimolecular mechanism and it is possible that this is the mechanism for this reaction at high temperatures.
At temperatures below 225 °C, the reaction is described by a rate law that is second order with respect to NO2:
rate = k[NO2]2
This is consistent with a mechanism that involves the following two elementary reaction steps:
1) NO2(g) + NO2(g) → NO3(g) + NO(g) (slow)
2) NO3(g) + CO(g) → CO2(g) + NO2(g) (fast)
___
NO2(g) + CO(g) → CO2(g) + NO(g) (overall)
The first step is slower and is therefore the rate-determining step, and gives a rate law showing second-order dependence on the NO2 concentration. The sum of the two elementary reaction steps gives the net overall reaction—the NO3 that is formed in step (1) is consumed in step (2), and one of the NO2 consumed in step (1) is reformed in step (2).
When the rate-determining (slower) step is the first step in a mechanism, as is the case for this example, the rate law for the overall reaction is the same as the rate law for this first step.
Ch10.12 Rate-Determining Step is Not the First Step in a Multistep Reaction
When the rate-determining step is preceded by a step involving an equilibrium reaction, the rate law for the overall reaction cannot be simply represented by the rate law of the rate-determining step.
An elementary reaction is at equilibrium when it proceeds in both the forward and reverse directions at equal rates. Consider the dimerization of NO to N2O2:
[latex]\text{NO}\;+\;\text{NO}\;{\rightleftharpoons}\;\text{N}_2\text{O}_2[/latex]
At equilibrium, the rate of the forward reaction is equal to the rate of the reverse reaction:
rateforward = ratereverse
k1[NO]2 = k–1[N2O2]
where k1 represents the rate constant of the forward reaction and k-1 represents the rate constant of the reverse reaction.
If N2O2 was an intermediate in a mechanism, this expression can be rearranged to represent the concentration of N2O2 in the overall rate law expression using algebraic manipulation:
Intermediates cannot be listed as part of the overall rate law expression, partly because it is extremely difficult to obtain their concentrations. However, they can be included in an individual elementary reaction of a mechanism. Example 1 will illustrate how to derive overall rate laws from mechanisms involving equilibrium steps preceding the rate-determining step.
Example 2
Deriving the Overall Rate Law Expression for a Multistep Reaction Mechanism
Nitryl chloride (NO2Cl) decomposes to nitrogen dioxide (NO2) and chlorine gas (Cl2) according to the following mechanism:
1) [latex]2\text{NO}_2\text{Cl}(g)\;{\rightleftharpoons}\;\text{ClO}_2(g)\;+\;\text{N}_2\text{O}(g)\;+\;\text{ClO}(g)[/latex] (fast)
2) [latex]\text{N}_2\text{O}(g)\;+\;\text{ClO}_2(g)\;{\rightleftharpoons}\;\text{NO}_2(g)\;+\;\text{NOCl}(g)[/latex] (fast)
3) [latex]\text{NOCl}\;+\;\text{ClO}\;{\longrightarrow}\;\text{NO}_2\;+\;\text{Cl}_2[/latex] (slow)
Determine the overall reaction, write the rate law expression for each elementary reaction step, identify any intermediates, and determine the overall rate law expression.
Solution
For determining the overall reaction: sum the three steps, cancel species that appear on both sides, and combine same molecules on same side:
2NO2Cl(g) → 2NO2(g) + Cl2(g)
To write the rate law for each elementary reaction step, remember that for elementary reactions, the rate law expression can be derived directly from the stoichiometry (We will use: for step (1) k1 for rate constant for forward reaction and k−1 for rate constant for the reverse reaction; for step (2) k2 for forward reaction and k−2 for reverse reaction; for step (3) k3: forward reaction.)
rate1 = k1[NO2Cl]2 = k-1[ClO2][N2O][ClO]
rate2 = k2[N2O][ClO2] = k-2[NO2][NOCl]
rate3 = k3[NOCl][ClO]
The last step, which is the slow step, is the rate-determining step. Therefore, the overall rate law expression could be written as Rateoverall = k3[NOCl][ClO]. However, both NOCl and ClO are intermediates, with difficult to determine concentrations. Algebraic expressions must be used to represent [NOCl] and [ClO] in terms of measurable reactant and product concentrations.
Using step (1), [latex][\text{ClO}] = \frac{k_1[\text{NO}_2\text{Cl}]^2}{k_{-1}[\text{ClO}_2][\text{N}_2\text{O}]}[/latex].
Using step (2), [latex][\text{NOCl}] = \frac{k_2[\text{N}_2\text{O}][\text{ClO}_2]}{k_{-2}[\text{NO}_2]}[/latex].
Substitute into the overall rate law:
[latex]\begin{array}{r @{{}={}} l} \text{rate}_\text{overall} & k_3(\frac{k_2[\text{N}_2\text{O}][\text{ClO}_2]}{k_{-2}[\text{NO}_2]})(\frac{k_1[\text{NO}_2\text{Cl}]^2}{k_{-1}[\text{ClO}_2][\text{N}_2\text{O}]}) \\[1em] & (\frac{k_3k_2k_1}{k_{-2}k_{-1}})\frac{[\text{NO}_2\text{Cl}]^2}{[\text{NO}_2]} \\[1em] & k_\text{overall}\frac{[\text{NO}_2\text{Cl}]^2}{[\text{NO}_2]}\end{array}[/latex]
where, [latex]k_\text{overall}=\frac{k_3k_2k_1}{k_{-2}k_{-1}}[/latex].
Notice that this rate law shows an inverse dependence on the concentration of one of the product species, which is an effect of the equilibria present in this particular multistep reaction.
Check Your Learning
The reaction of methanol (CH3OH) and HBr is proposed to have two elementary reaction steps:
1) [latex]\text{CH}_3\text{OH}\;+\;\text{H}^+\;{\rightleftharpoons}\;\text{CH}_3\text{OH}_2^+[/latex] (fast)
2) [latex]\text{CH}_3\text{OH}_2^+\;+\;\text{Br}^-\;{\longrightarrow}\;\text{CH}_3\text{Br}\;+\;\text{H}_2\text{O}[/latex] (slow)
Determine the overall reaction, write the rate law expression for each elementary reaction, and determine the overall rate law expression.
Answer:
overall reaction: CH3OH + H+ + Br– → CH3Br + H2
rate1 = k1[CH3OH][H+] = k–1[CH3OH2+]
rate2 = k2[CH3OH2+][Br–]
[latex]\text{rate}_\text{overall} = (\frac{k_2k_1}{k_{-1}})[\text{CH}_3\text{OH}][\text{H}^+][\text{Br}^-][/latex]
Ch10.13 Catalysis
The rate of a reaction can be accelerated by a catalyst, which speeds up the rate by lowering the activation energy. The catalyst itself is not consumed by the reaction, as it is regenerated in the process.
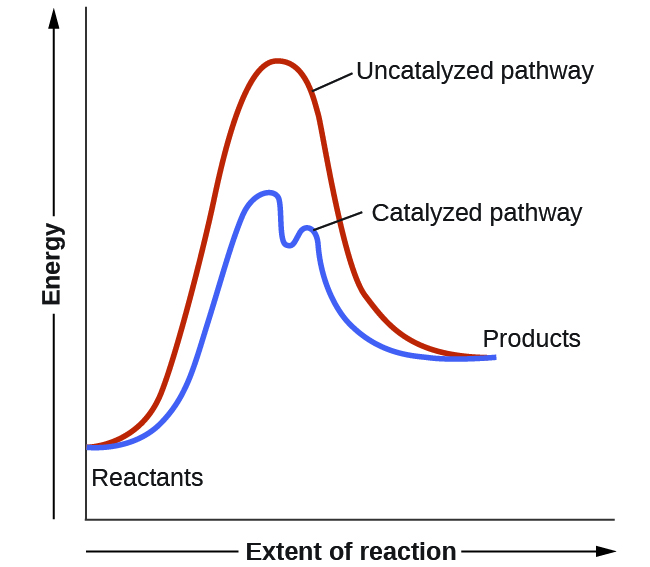
Catalysts function by providing an alternate reaction mechanism that has a lower activation energy than would be found in the absence of the catalyst. Often, the catalyzed mechanism include additional steps, as shown by the example reaction diagrams in Figure 11. The lower activation energy involved in the catalyzed pathway results in an increase in rate as described by the Arrhenius equation. Note that a catalyst decreases the activation energy for both the forward and the reverse reactions and hence accelerates both the forward and the reverse reactions. Consequently, the presence of a catalyst will permit a system to reach equilibrium more quickly, but it has no effect on the relative energies of the reactants and products.
Example 3
Using Reaction Diagrams to Compare Catalyzed and Uncatalyzed Reactions
The two reaction diagrams here represent the same reaction: one without a catalyst and one with a catalyst. Identify which diagram suggests the presence of a catalyst, and determine the activation energy for the catalyzed reaction:
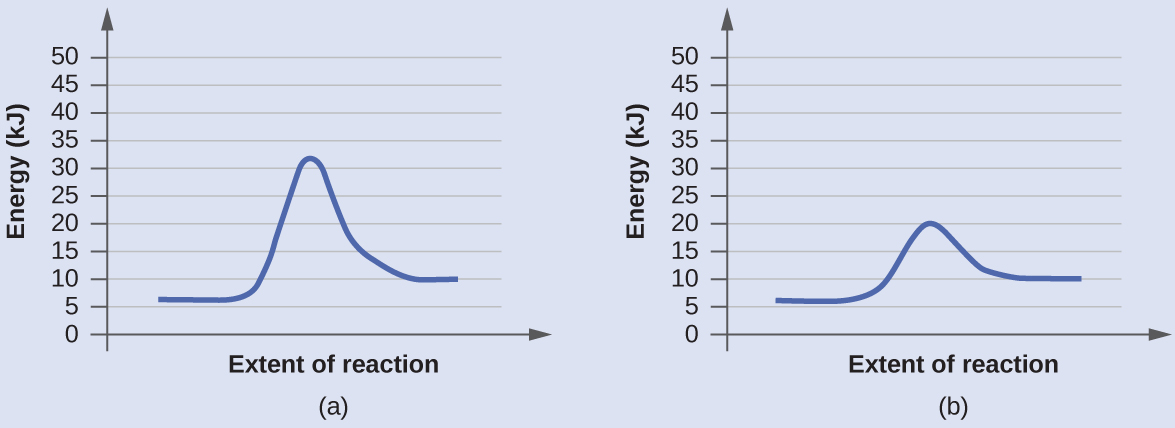
Solution
A catalyst does not affect the energy of reactants or products, so those aspects of the diagrams are the same. There is, however, a noticeable difference in the transition state, which is distinctly lower in diagram (b) than it is in (a). This indicates the use of a catalyst in (b). The activation energy is the difference between the energy of the starting reagents and the transition state—a maximum on the reaction coordinate diagram. The reagents are at 6 kJ/mol and the transition state is at 20 kJ/mol, so the activation energy can be calculated as follows:
Ea = 20 kJ/mol – 6 kJ/mol = 14 kJ/mol
Check Your Learning
Determine which of the two diagrams here (both for the same reaction) involves a catalyst, and identify the activation energy for the catalyzed reaction:
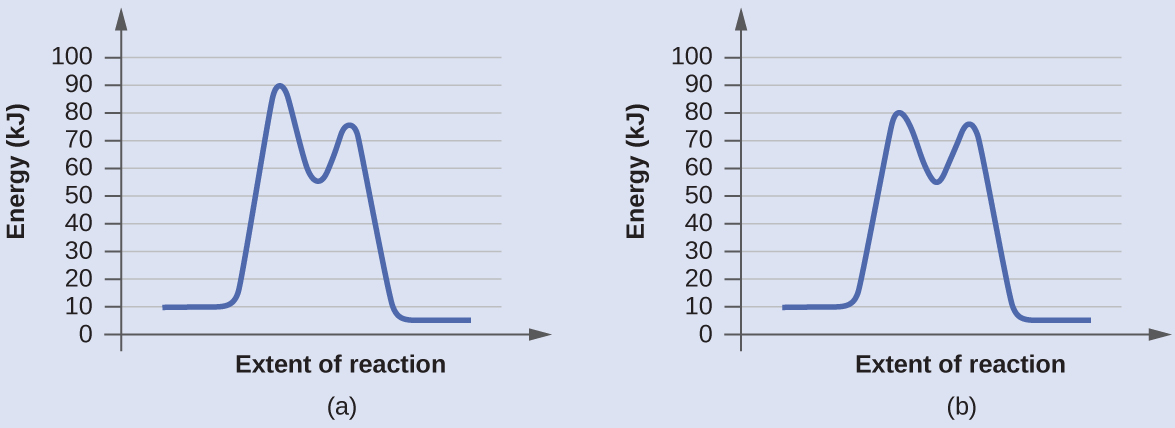
Answer:
Diagram (b) is a catalyzed reaction with an activation energy of about 70 kJ/mol.
Ch10.14 Homogeneous Catalysts
A homogeneous catalyst is present in the same phase as the reactants. It interacts with a reactant to form an intermediate substance, which then decomposes or reacts with another reactant in one or more steps to regenerate the original catalyst and form product.
As an important illustration of homogeneous catalysis, consider the earth’s ozone layer. Ozone in the upper atmosphere, which protects the earth from ultraviolet radiation, is formed when oxygen molecules absorb UV photons and undergo the reaction:
Ozone is a relatively unstable molecule that decomposes to yield O2 with the following mechanism:
The presence of nitric oxide, NO, influences the rate of decomposition of ozone. Nitric oxide acts as a catalyst in the following mechanism:
Nitric oxide reacts and is regenerated in these reactions. It is not permanently used up; thus, it acts as a catalyst. The overall chemical change for the catalyzed mechanism is the same as the uncatalyzed reaction:
The rate of decomposition of ozone is greater in the presence of nitric oxide because of the catalytic activity of NO. Certain compounds that contain chlorine also catalyze the decomposition of ozone.
Mario J. Molina
The 1995 Nobel Prize in Chemistry was shared by Paul J. Crutzen, Mario J. Molina (Figure 12), and F. Sherwood Rowland “for their work in atmospheric chemistry, particularly concerning the formation and decomposition of ozone.”
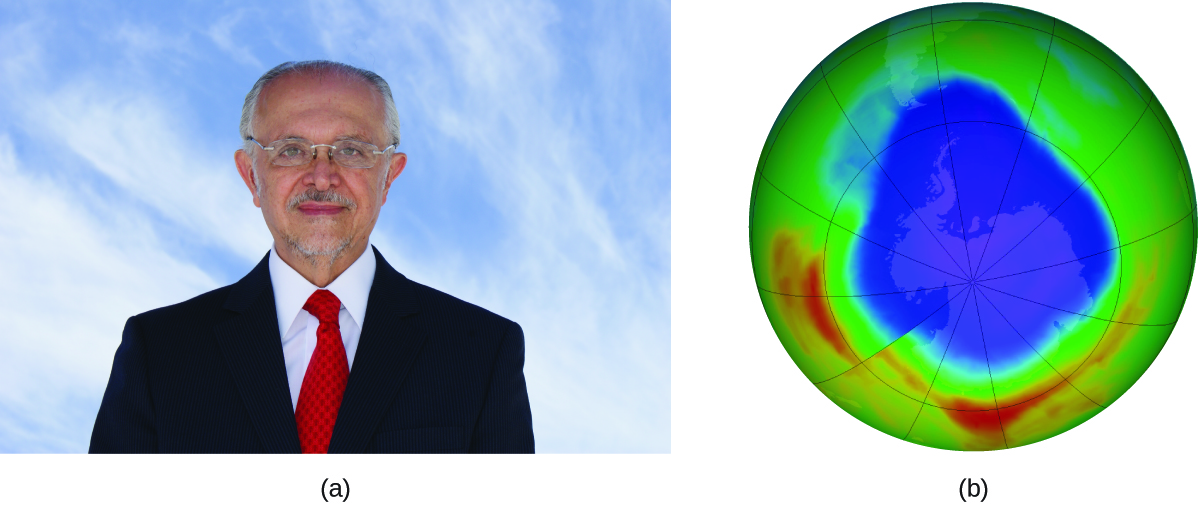
In 1974, Molina and Rowland published a paper in the journal Nature detailing the threat of chlorofluorocarbon gases to the stability of the ozone layer in earth’s upper atmosphere. The ozone layer protects earth from solar radiation by absorbing ultraviolet light. As chemical reactions deplete the amount of ozone in the upper atmosphere, a measurable “hole” forms above Antarctica, and an increase in the amount of solar ultraviolet radiation— strongly linked to the prevalence of skin cancers—reaches earth’s surface. The work of Molina and Rowland was instrumental in the adoption of the Montreal Protocol, an international treaty signed in 1987 that successfully began phasing out production of chemicals linked to ozone destruction.
Molina and Rowland demonstrated that chlorine atoms from human-made chemicals can catalyze ozone destruction in a process similar to that by which NO accelerates the depletion of ozone. Chlorine atoms are generated when chlorocarbons or chlorofluorocarbons—once widely used as refrigerants and propellants—are photochemically decomposed by ultraviolet light or react with hydroxyl radicals. For example:
Chlorine radicals break down ozone and are regenerated by the following catalytic cycle:
A single chlorine atom can break down thousands of ozone molecules. Luckily, the majority of atmospheric chlorine exists as the catalytically inactive forms Cl2 and ClONO2.
Ch10.15 Heterogeneous Catalysts
A heterogeneous catalyst is a catalyst that is present in a different phase (usually a solid) than the reactants. Such catalysts generally function by furnishing an active surface upon which a reaction can occur. Gas and liquid phase reactions catalyzed by heterogeneous catalysts occur on the surface of the catalyst rather than within the gas or liquid phase.
Heterogeneous catalysis has at least four steps:
- Adsorption of the reactant onto the surface of the catalyst
- Activation of the adsorbed reactant
- Reaction of the adsorbed reactant
- Diffusion of the product from the surface into the gas or liquid phase (desorption).
Any one of these steps may be slow and thus may serve as the rate determining step. In general, however, in the presence of the catalyst, the overall rate of the reaction is faster than it would be without the catalyst.
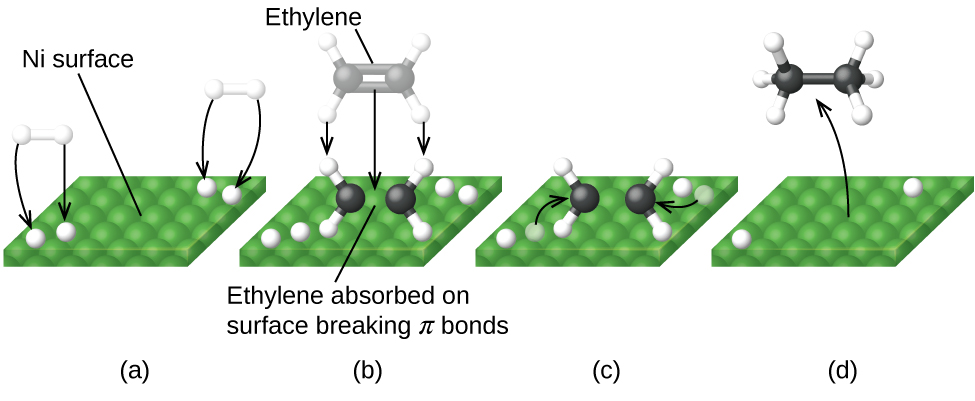
Figure 13 illustrates the reaction of alkenes with hydrogen on a nickel catalyst. Nickel is the catalyst used in the hydrogenation of polyunsaturated fats and oils to produce saturated fats and oils.
Other significant industrial processes that involve the use of heterogeneous catalysts include the preparation of sulfuric acid, the preparation of ammonia, the oxidation of ammonia to nitric acid, and the synthesis of methanol. Heterogeneous catalysts are also used in the catalytic converters found on most gasoline-powered automobiles.
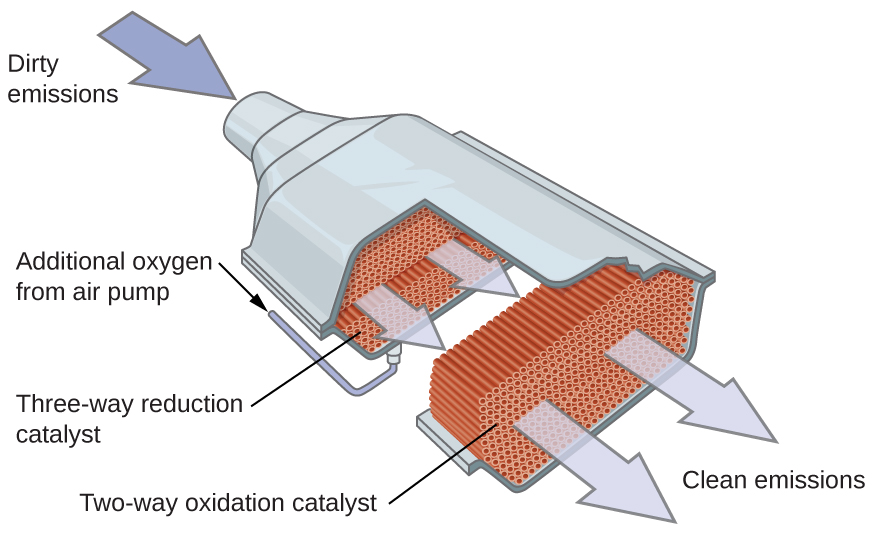
Automobile Catalytic Converters
Scientists developed catalytic converters to reduce the amount of toxic emissions produced by burning gasoline in internal combustion engines. Catalytic converters take advantage of all five factors that affect the speed of chemical reactions to ensure that exhaust emissions are as safe as possible.
By utilizing a carefully selected blend of catalytically active metals, it is possible to ensure all carbon-containing compounds are converted to carbon dioxide while also reducing the output of nitrogen oxides. This is particularly impressive when we consider that one step involves adding more oxygen to the molecule and the other involves removing the oxygen (Figure 14).
Most modern, three-way catalytic converters possess a surface impregnated with a platinum-rhodium catalyst, which catalyzes the conversion nitric oxide into N2 and O2:
2NO2(g) → N2(g) + 2O2(g)
as well as the conversion of carbon monoxide into carbon dioxide
2CO(g) + O2(g) → 2CO2(g)
and hydrocarbons such as octane into carbon dioxide and water vapor:
2C8H18(g) + 25O2(g) → 16CO2(g) + 18H2O(g)
In order to be as efficient as possible, most catalytic converters are preheated by an electric heater. This ensures that the metals in the catalyst are fully active even before the automobile exhaust is hot enough to maintain appropriate reaction temperatures.
The University of California at Davis’ “ChemWiki” provides a thorough explanation of how catalytic converters work.
Ch10.16 Enzymes
The study of enzymes is an important interconnection between biology and chemistry. Enzymes are usually proteins (polypeptides) that help to control the rate of chemical reactions between biologically important compounds, particularly those that are involved in cellular metabolism. Different classes of enzymes perform a variety of functions, a few examples are shown in Table 1.
| Class | Function |
|---|---|
| oxidoreductases | redox reactions |
| transferases | transfer of functional groups |
| hydrolases | hydrolysis reactions |
| lyases | group elimination to form double bonds |
| isomerases | isomerization |
| ligases | bond formation with ATP hydrolysis |
| Table 1. Classes of Enzymes and Their Functions | |
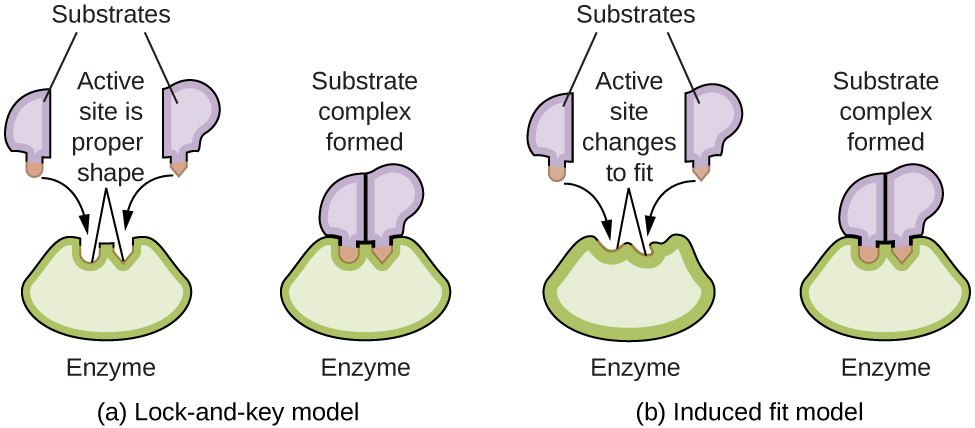
Enzyme molecules possess an active site, a part of the molecule with a shape that allows it to bond to a specific substrate (a reactant molecule), forming an enzyme-substrate complex as a reaction intermediate. There are two models that attempt to explain how this active site works. The most simplistic model is referred to as the lock-and-key hypothesis, which suggests that the molecular shapes of the active site and substrate are complementary, fitting together like a key in a lock. The induced fit hypothesis, on the other hand, suggests that the enzyme molecule is flexible and changes shape to accommodate a bond with the substrate. This is not to suggest that an enzyme’s active site is completely malleable, however. Both the lock-and-key model and the induced fit model account for the fact that enzymes can only bind with specific substrates, since in general a particular enzyme only catalyzes a particular reaction (Figure 15).
Glucose-6-Phosphate Dehydrogenase Deficiency
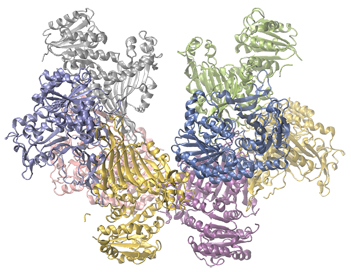
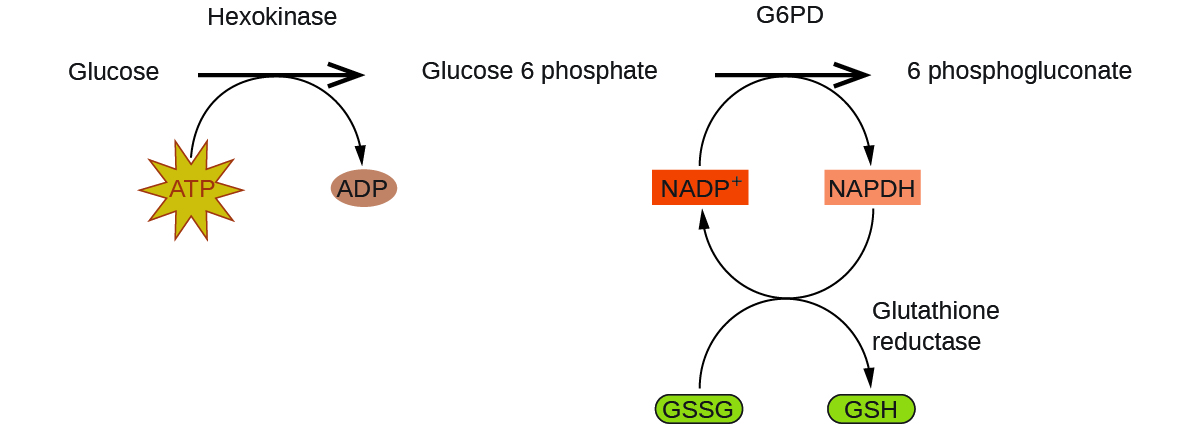
Enzymes in the human body act as catalysts for important chemical reactions in cellular metabolism. As such, a deficiency of a particular enzyme can translate to a life-threatening disease. G6PD (glucose-6-phosphate dehydrogenase) deficiency, a genetic condition that results in a shortage of the enzyme glucose-6-phosphate dehydrogenase, is the most common enzyme deficiency in humans. This enzyme, shown in Figure 16, is the rate-limiting enzyme for the metabolic pathway that supplies NADPH to cells (Figure 17).
A disruption in this pathway can lead to reduced glutathione in red blood cells; once all glutathione is consumed, enzymes and other proteins such as hemoglobin are susceptible to damage. For example, hemoglobin can be metabolized to bilirubin, which leads to jaundice, a condition that can become severe. People who suffer from G6PD deficiency must avoid certain foods and medicines containing chemicals that can trigger damage their glutathione-deficient red blood cells.
The Royal Society of Chemistry provides an excellent introduction to enzymes for students and teachers.
Ch10.17 Enzyme Kinetics
The Michaelis-Menten mechanism is one which many enzyme catalyzed reactions follow. The basic mechanism involves an enzyme (E) and a substrate (S) which must connect to form an enzyme-substrate complex (ES) in order for the substrate to be reacted to form a product (P). The overall reaction is:
And the simple two-step mechanism is:
The kinetics of this reaction can be derived using the steady state approximation, which applies to reactions where the concentration of a highly reactive (i.e. short-lived) intermediate is approximately constant over the course of the reaction. Hence, for such an intermediate (I),
In the enzyme catalyzed reaction, we can apply steady state approximation to the concentration of the ES intermediate complex:
Solving for [ES] gives:
or
where KM is the Michaelis constant,
which is affected by a number of factors, including pH, temperature, and the nature of the substrate itself.
Using a mass conservation relationship on the enzyme—the enzyme must be either in its bare form (E) or complexed with a substrate (ES), we have:
Or:
Substituting this into the above equation:
Rearranging the variables:
Substituting this into the expression for the rate of production of the product, or the observed reaction rate:
yields
or
where Vmax = k2[E]total is the maximum rate the reaction can achieve.
In the limit that [S] is very large, where [S] ≫ KM and [S] + KM ≈ [S], the reaction reaches its maximum rate (rate = Vmax) and becomes independent of any concentrations.
In the limit that [S]≪KM, hence [S] + KM ≈ KM, the reaction is first order in [S]:
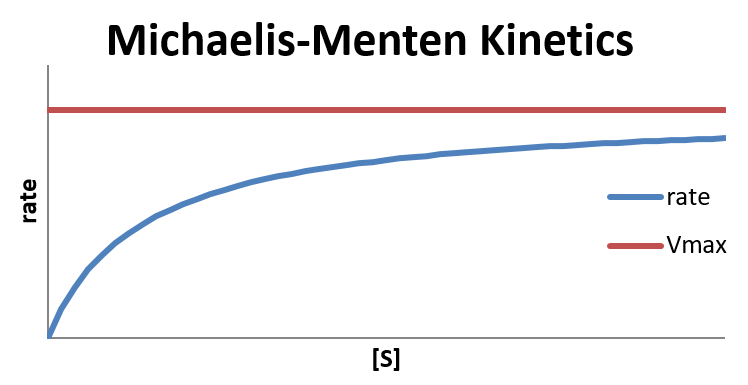
The Michaelis constant KM is the substrate concentration at which the reaction rate is at half-maximum, and is an inverse measure of the substrate’s affinity for the enzyme—as a small KM indicates high affinity, meaning that the rate will approach Vmax more quickly. The value of KM is dependent on both the enzyme and the substrate, as well as conditions such as temperature and pH.
Denaturation
Enzymes are generally globular proteins, acting alone or in larger complexes. Like all proteins, enzymes are linear chains of amino acids that fold to produce a three-dimensional structure. The sequence of the amino acids specifies the structure which in turn determines the catalytic activity of the enzyme. Enzyme structures unfold (denature) when heated or exposed to chemical denaturants and this disruption to the structure typically causes a loss of activity.
Protein folding is key to whether a globular protein or a membrane protein can do its job correctly. It must be folded into the right shape to function. But hydrogen bonds, which play a big part in folding, are rather weak, and it does not take much heat, acidity, or other stress to break some and form others, denaturing the protein. This is one reason why tight homeostasis is physiologically necessary in many life forms.
Denaturation is a process in which proteins or nucleic acids lose the quaternary structure, tertiary structure and secondary structure which is present in their native state, by application of some external stress or compound such as a strong acid or base, a concentrated inorganic salt, an organic solvent (e.g., alcohol or chloroform), radiation or heat. If proteins in a living cell are denatured, this results in disruption of cell activity and possibly cell death. Denatured proteins can exhibit a wide range of characteristics, from conformational change and loss of solubility to aggregation due to the exposure of hydrophobic groups.

Enzyme denaturation is normally linked to temperatures above a species normal level; as a result, enzymes from bacteria living in volcanic environments such as hot springs are prized by industrial users for their ability to function at high temperatures, allowing enzyme-catalyzed reactions to be operated at a very high rate.
Inhibition
When an inhibitor interacts with an enzyme it decreases the enzyme’s catalytic efficiency. An irreversible inhibitor covalently binds to the enzyme’s active site, producing a permanent loss in catalytic efficiency even if we decrease the inhibitor’s concentration. A reversible inhibitor forms a noncovalent complex with the enzyme, resulting in a temporary decrease in catalytic efficiency. If we remove the inhibitor, the enzyme’s catalytic efficiency returns to its normal level.
There are several pathways for the reversible binding of an inhibitor to an enzyme, as shown in Figure 20. In competitive inhibition the substrate and the inhibitor compete for the same active site on the enzyme. Because the substrate cannot bind to an enzyme–inhibitor complex, EI, the enzyme’s catalytic efficiency for the substrate decreases. With noncompetitive inhibition the substrate and the inhibitor bind to different active sites on the enzyme, forming an enzyme–substrate–inhibitor, or ESI complex. The formation of an ESI complex decreases catalytic efficiency because only the enzyme–substrate complex reacts to form the product. Finally, in uncompetitive inhibition the inhibitor binds to the enzyme–substrate complex, forming an inactive ESI complex.

