
Unit Three
Day 23: Activation Energy and Effect of Temperature
As you work through this section, if you find that you need a bit more background material to help you understand the topics at hand, you can consult “Chemistry: The Molecular Science” (5th ed. Moore and Stanitski) Chapter 11-5 and 11-7, and/or Chapter 10.6-10.9 in the Additional Reading Materials section.
D23.1 Activation Energy
We used this bimolecular reaction to illustrate the importance of the steric factor when creating the desired product:
However, even if a collision occurs with the proper orientation, the reaction does not proceed unless the kinetic energy of the collision is at least as high as the activation energy (Ea, Figure 1), as per postulate 2 of the collision theory (Section D22.4).
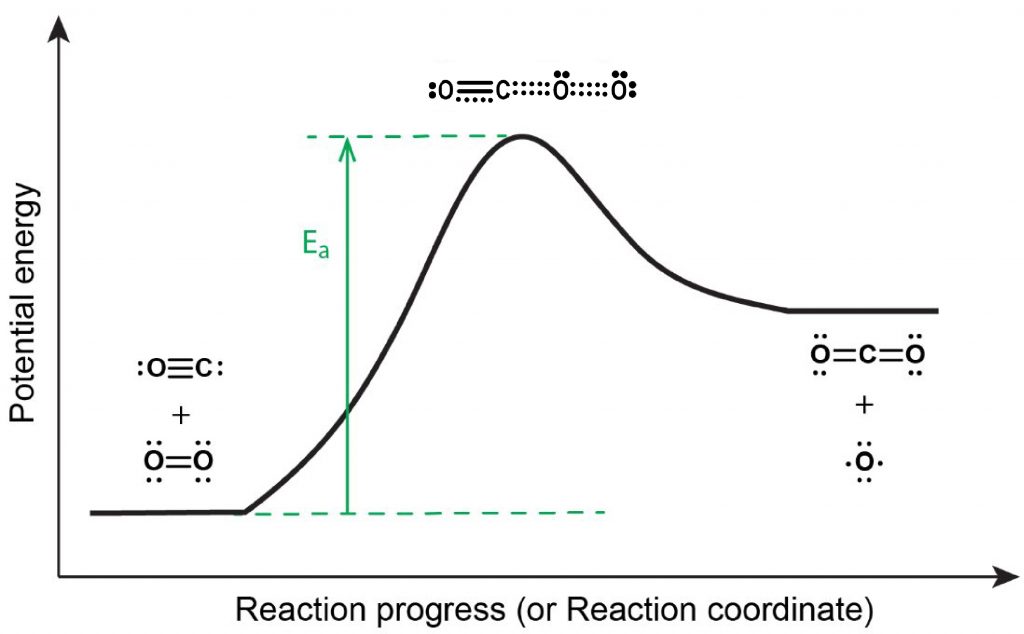
If the activation energy is much larger than the average kinetic energy of the reactants, Ea >> KEavg, the reaction will occur slowly—only a few fast-moving molecules will have enough energy to react. If Ea << KEavg, most collisions between reactant molecules with proper orientation will result in reaction, and the reaction will proceed rapidly.
Because a transition state (activated complex) has greater energy than either reactant molecules or product molecules the transition state is unstable and exists for a very short time. This makes it very difficult to study activated complexes. For the example in Figure 1, activated complexes have only been observed spectroscopically in systems that utilize a heterogeneous catalyst.
D23.2 Arrhenius Equation
The rate of reaction changes with temperature because the rate “constant” varies with temperature. (Recall that the rate constant was said to be constant at a given temperature.) The Arrhenius equation relates the activation energy and the rate constant of a given reaction:
In this equation, e is the base of natural logarithms, R is the ideal gas constant (8.314 J mol−1 K−1), T is absolute temperature (Kelvins), and Ea must be expressed in J/mol for units to cancel. The constant A is called the frequency factor and depends on the rate at which collisions occur and the fraction of collisions that have the correct orientation. The exponential term, [latex]e^{-E_a/RT}[/latex], is the fraction of the total number of collisions that has sufficient energy to overcome the activation-energy barrier of the reaction.
The Arrhenius equation describes quantitatively much of what we have already discussed about reaction rates. For example, for two similar reactions occurring at the same temperature, the reaction with the higher activation energy (smaller value for [latex]e^{-E_a/RT}[/latex]) has the lower rate constant and hence is slower. Also, a change in conditions that increases the number of collisions with a favorable orientation results in an increase in A and, consequently, an increase in k.
Exercise 1: Calculating Rate Constants
Consider a unimolecular reaction with frequency factor (A) = 1.00 × 10¹² s-1 and activation energy (Ea) = 80.0 kJ/mol. Calculate the rate constant for the reaction at 100. K, 200. K, and 300. K.
D23.3 Temperature and Fraction of Molecules Exceeding Ea
The kinetic energy (KE) of a particle of mass (m) and speed (v) is:
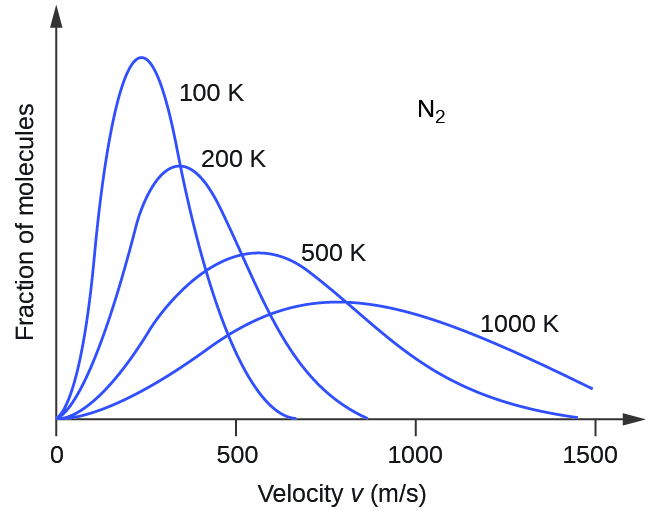
Thus, kinetic energy increases with the square of the molecular speed. Because not all molecules in a sample of gas are moving at the same speed there is a distribution of molecular speeds (and energy). The distribution is known as a Maxwell-Boltzmann distribution. It shows the fraction of molecules that have each different speed, as seen in Figure 2.
The average kinetic energy of a collection of gas molecules, KEavg, can be calculated from the Maxwell-Boltzmann distribution and is directly proportional to the temperature of the gas:
If the temperature of a gas increases, its KEavg increases, and the Maxwell-Boltzmann distribution shifts toward higher speeds overall. If temperature decreases, KEavg decreases, and the distribution shifts toward lower speeds overall.
The areas under curves like those in Figure 2 are proportional to the number of molecules; hence the areas under all curves for different temperatures are the same (because all are for the same sample of gas). Within a range of molecular speeds (such as all speeds between 500 m/s and 1000 m/s) the area under the curve is proportional to the number of molecules whose speeds are within that range. Figure 3 shows that increasing the temperature of a reaction is similar to decreasing the activation energy of a reaction:
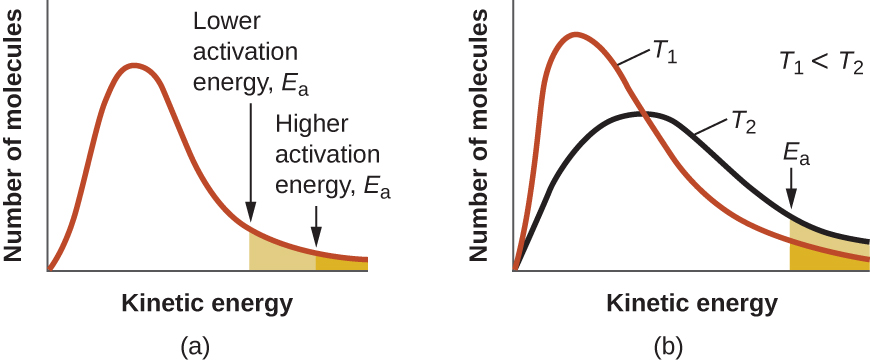
At a given temperature, some fraction of the molecules has kinetic energies equal to or higher than the reaction’s Ea. At a higher temperature, a larger fraction of molecules has the necessary energy to react, which corresponds to an increase in the value of [latex]e^{-E_a/RT}[/latex].
Exercise 2: Activation Energy and Temperature
D23.4 Arrhenius Plot
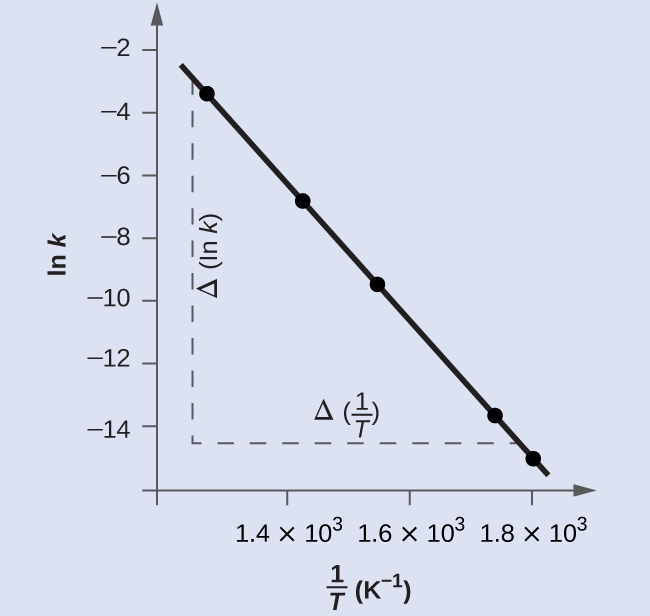
A convenient way to determine Ea for a reaction involves measuring k at different temperatures and using an alternate version of the Arrhenius equation derived by taking the natural logarithm of both sides of the equation:
Thus, a plot of ln(k) versus 1/T gives a straight line with slope = –Ea/R and y-intercept = ln(A).
Example 1
Determination of Ea
The variation of the rate constant with temperature for the decomposition of HI:
2 HI(g) → H2(g) + I2(g)
is given here. Determine the activation energy for the reaction.
| T (K) | k (M-1s-1) |
|---|---|
| 555 | 3.52 × 10⁻⁷ |
| 575 | 1.22 × 10⁻⁶ |
| 645 | 8.59 × 10⁻⁵ |
| 700 | 1.16 × 10⁻³ |
| 781 | 3.95 × 10⁻² |
Solution
Values of [latex]\dfrac{1}{T}[/latex] and ln(k) are:
| [latex]\dfrac{1}{T}\;(K^{-1})[/latex] | ln k |
|---|---|
| 1.80 × 10⁻³ | −14.860 |
| 1.74 × 10⁻³ | −13.617 |
| 1.55 × 10⁻³ | −9.362 |
| 1.43 × 10⁻³ | −6.759 |
| 1.28 × 10⁻³ | −3.231 |
Figure 4 is a graph of ln(k) versus [latex]\frac{1}{T}[/latex]. A linear fit of the data gives slope = [latex]\frac{Δ (\text{ln}\;k)}{Δ(1/T)}[/latex] = -2.23×10⁴ K.
To determine the activation energy:
It is possible to obtain a reasonable estimate of the activation energy without going through the entire process of constructing the Arrhenius plot. The slope of the plot is
[latex]\text{Slope} = \dfrac{{\Delta}(\text{ln}\;k)}{{\Delta}(\dfrac{1}{T})} = -\dfrac{E_{\text{a}}}{R}[/latex]
The Arrhenius equation:
can therefore take the form (by subtracting the Arrhenius equation with k2 and T2 from the Arrhenius equation with k1 and T1):
or
or
Using the experimental data presented here, we can simply select two data entries, for example, the first entry and the last entry:
| T (K) | k (M-1s-1) |
|---|---|
| 555 | 3.52 × 10⁻⁷ |
| 781 | 3.95 × 10⁻² |
and substitute into the equation:
This method is useful when a limited number of temperature-dependent rate constants are available for the reaction of interest.
Check Your Learning
The rate constant for the rate of decomposition of N2O5 to NO and O2 in the gas phase:
2 N2O5(g) → 4 NO(g) + 3 O2(g)
is 1.66 M-1s-1 at 650. K and 7.39 M-1s-1 at 700. K. Assuming this reaction obeys the Arrhenius equation, calculate the activation energy.
Answer:
1.13×10⁵ J/mol
D23.5 Multi-step Reactions
The mechanism for a multi-step reaction consists of a series of elementary reactions whose sum gives the overall balanced reaction equation. Moreover, the mechanism must agree with the experimental rate law. Mechanisms in which one elementary step is followed by another are very common. Here is a generic example, where Q is a reaction intermediate:
If both elementary reaction steps proceed at about the same rate, experiments that determine the rate law would not necessarily reveal that two separate steps are involved. (However, if the overall reaction took place in a single step it would be trimolecular, with one A and two B molecules colliding simultaneously. As discussed in Section D22.5, trimolecular elementary reactions are quite rare. If a reaction involves more than two reactant molecules, chances are it involves multiple reaction steps.)
When the rates of the two steps are quite different, things can get interesting and lead to quite varied kinetics as well as some simplifying approximations. When the rate constants of a series of consecutive reactions are quite different, a number of relationships can come into play that greatly simplify our understanding of the observed reaction kinetics. We will discuss this in more detail in the next sections.
Podia Question
Watch this video showing two “light sticks”, one in hot water and one on ice.
Recall that when atoms are heated to high temperatures atomic emission spectra result (Section D2.2). In light sticks, chemical reactions (called chemiluminescent reactions) emit light even though the emitting substance has not been heated to high temperature. In a chemiluminescent reaction a reaction intermediate is formed in an excited state. It is customary to indicate an excited state with an asterisk; for example, H* represents an excited state of a H atom. In some chemiluminescent reactions two reactants are mixed and light is emitted until the reaction is over. The crack sound you can hear on the video is because a small glass vial in each light stick was broken, allowing two reactants to combine.
1. Write a simple mechanism for a chemiluminescent reaction. Label reactants as A and B. Use other letters of the alphabet for intermediate and product molecules. Use an asterisk to indicate any excited state. Show that the individual elementary reaction steps sum to an overall reaction. Identify reaction intermediate(s).
2. Explain clearly why the light stick that was in hot water is brighter.
3. Suggest a reason that a reaction intermediate might be formed in an excited state instead of the ground state.
4. Predict which of the two light sticks in the video glows for the longer time. Explain your prediction.
Two days before the next whole-class session, this Podia question will become live on Podia, where you can submit your answer.
