
Unit Four
Day 37: Acid-Base Titration
As you work through this section, if you find that you need a bit more background material to help you understand the topics at hand, you can consult “Chemistry: The Molecular Science” (5th ed. Moore and Stanitski) Chapter 15-2, and/or Chapter 16.5-16.8 in the Additional Reading Materials section.
D37.1 Titration
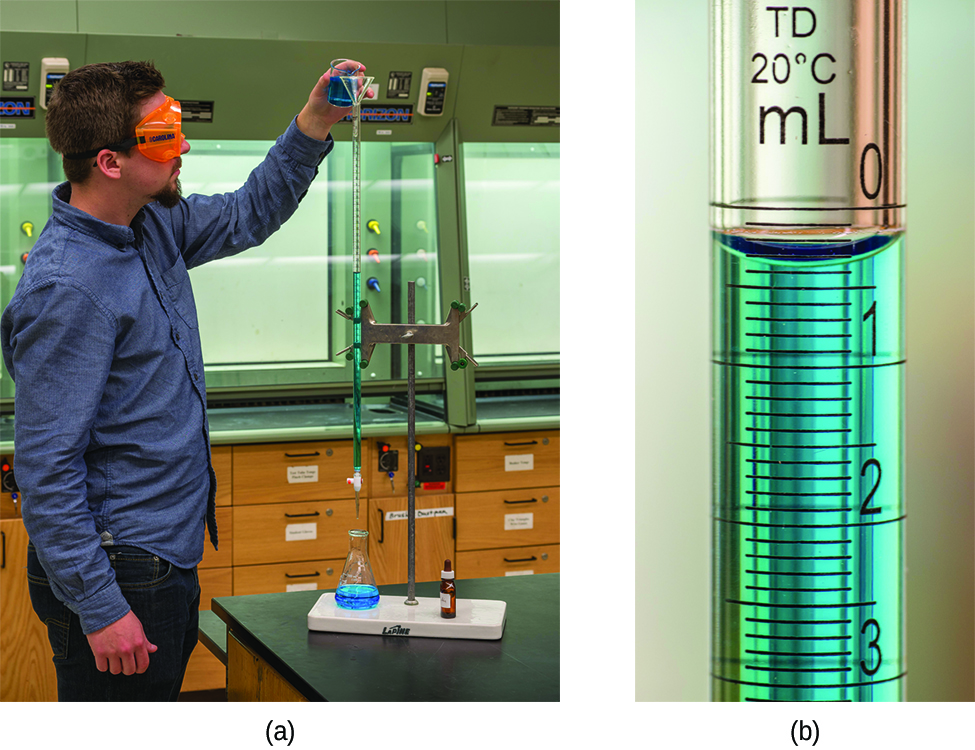
In a titration, one solution is added to a second solution in a way that allows the quantity of each solution to be measured accurately. A chemical reaction occurs between solutes in the two solutions and exactly enough of the first solution is added to react completely with the second solution. Typically, one solution is added from a buret, a calibrated glass tube with a stopcock at the bottom (Figure 1). The buret allows additions of very small increments of volume and determination of the total volume added. The solution added from the buret is the titrant. Titrant is added to a carefully measured volume of a second solution in a flask or beaker. When just enough titrant has been added for complete reaction with the second solution, the equivalence point of the titration has been reached. From the balanced chemical equation for the titration reaction, the volume of each solution at the equivalence point, and the concentration of one of the two solutions, the concentration of the other solution can be determined.
The equivalence point of a titration may be detected visually if a distinct change in the appearance of the sample solution accompanies the completion of the reaction. For example, in the titration of oxalic acid with potassium permanganate, the reaction is
5 H2C2O4(aq) + 2 MnO4−(aq) + 6 H+(aq) → 10 CO2(g) + 2 Mn2+(aq) + 8 H2O(l)
Permanganate ion is purple and all other species are colorless. If the permanganate solution is delivered from a buret to oxalic acid in a flask, the flask is colorless until all the oxalic acid has reacted with permanganate. The next tiny increment of permanganate solution causes a pale purple color in the flask because there is no more oxalic acid to react with permanganate and remove the color. More commonly, a special dye called an indicator is added to the solution being titrated to provide a color change at or very near the equivalence point. Equivalence points may also be detected by measuring some solution property that changes in a predictable way during the course of the titration, such as pH.
Exercise 1: Equivalence Point
Regardless of the approach taken to detect a titration’s equivalence point, the volume of titrant actually measured is called the end point. Properly designed titration methods typically ensure that the difference between the equivalence and end points is negligible. Though any type of chemical reaction may serve as the basis for a titration analysis, precipitation, acid-base, and oxidation-reduction titrations are most common.
Example 1
Titration Analysis
The end point in a titration of a 50.00-mL sample of aqueous HCl was reached by addition of 35.23 mL of 0.250 M NaOH titrant. The titration reaction is:
[latex]\text{HCl}(aq) + \text{NaOH}(aq) \longrightarrow \text{NaCl}(aq) + \text{H}_2\text{O}(l)[/latex]
Calculate the concentration of the HCl.
Solution
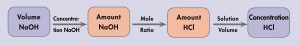
The balanced chemical equation shows that 1 mol HCl reacts with 1 mol NaOH; that is, the mole ratio is (1 mol HCl)/(1 mol NaOH). From the volume and concentration of the NaOH solution, we can calculate the amount (mol) of NaOH. The mole ratio allows calculation of the amount of HCl. The concentration of HCl is the amount per unit volume. These steps are summarized as
The amount of HCl is
[latex]n(\text{HCl}) =35.23 \;\text{mL NaOH} \times \dfrac{1 \;\text{L}}{1000\;\text{mL}} \times \dfrac{0.250 \;\text{mol NaOH}}{1 \;\text{L}} \times \dfrac{1 \;\text{mol HCl}}{1 \;\text{mol NaOH}} = 8.81 \times 10^{-3} \;\text{mol HCl}[/latex]
The HCl concentration is:
Check Your Learning
A 20.00-mL sample of aqueous oxalic acid, H2C2O4, was titrated with 0.09113-M potassium permanganate, KMnO4. (The reaction equation was given earlier.) A volume of 23.24 mL was required to reach the end point. Calculate the concentration of oxalic acid.
Answer:
0.2648 M
Exercise 2: Titration Stoichiometry
It took 12.4 mL of 0.205 M HCl solution to titrate 20.0 mL of a NaOH solution to the equivalence point. Calculate the concentration of the original NaOH solution.
D37.2 Titration Curves
Titrations can be used to analyze solutions quantitatively for their acid or base concentrations because pH changes rapidly near the equivalence point. Acid-base indicators change color over a range of about 2 pH units, so if pH increases (or decreases) by 2 or more pH units when 0.01 mL titrant is added at the equivalence point, the color change signals the end point of the titration.
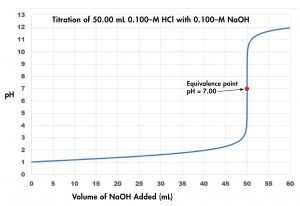
Figure 2 shows a graph of pH as a function of volume of titrant, a titration curve, for the titration of a 50.0-mL sample of 0.100-M hydrochloric acid with 0.100-M sodium hydroxide. The pH increases slowly at first, increases rapidly when nearly 50.0 mL NaOH has been added, and then increases slowly again. The point of inflection (steepest slope) is the equivalence point for the titration, and indicates when stoichiometrically equivalent quantities of acid and base are present. For the titration of a strong acid with a strong base, the equivalence point occurs at pH = 7.00.
Example 2
Calculating pH for Titration Solutions: Strong Acid/Strong Base
A titration is carried out for 50.00 mL of 0.100-M HCl (strong acid) with 0.100-M NaOH (strong base). The titration curve is shown in Figure 3. Calculate the pH at these volumes of added base solution:
(a) 0.00 mL
(b) 25.00 mL
(c) 50.00 mL
(d) 60.00 mL
Solution
Because HCl is a strong acid, assume that all of it ionizes. The initial concentration of H3O+ is 0.100 M. When the base solution is added, it also dissociates completely, providing OH− ions. The H3O+ and OH− ions neutralize each other, so the ions in excess remain. Their concentration determines the pH. Thus, the solution is initially acidic (pH < 7), but eventually all the hydronium ions are neutralized, and the solution becomes neutral. As more base is added further, the solution turns basic. At the equivalence point the solution contains Na+ and Cl− ions, neither of which has detectable acid or base properties so pH = 7.00.
First we derive general equations for the concentration of hydronium ions before, at, and after the equivalence point.
The initial amount of hydronium ion is:
Once X mL of the 0.100-M base solution is added, the amount of OH− ion introduced is:
The total volume becomes
As long as [latex]\text{n}(\text{H}_3\text{O}^{+})_0\;-\;\text{n(OH}^{-})_\text{added}\;>\;0[/latex], the amount of H3O+ remaining after reaction with OH− is
The concentration of H3O+ is
When [latex]\text{n}(\text{H}_3\text{O}^{+})_0 = \text{n(OH}^{-})_\text{added}[/latex], the H3O+ ions from the acid and the OH− ions from the base mutually neutralize. At this point, the equivalence point, the only hydronium ions left are those from the autoionization of water. Therefore, in this case:
Finally, when [latex]\text{n(OH}^{-})_\text{added}\;>\;\text{n}(\text{H}_3\text{O}^{+})_0[/latex], hydroxide ion is in excess and we calculate
[latex]\text{n(OH}^{-}) = \text{n(OH}^{-})_\text{added}\;-\;\text{n}(\text{H}_3\text{O}^{+})_0[/latex]
In this case:
Now consider the four specific cases presented in this problem:
(a) X = 0 mL
pH = −log(0.100) = 1.000
(b) X = 25.00 mL
pH = −log(0.0333) = 1.477
(c) X = 50.00 mL
Since [latex]\text{n}(\text{H}_3\text{O}^{+})_0 = \text{n(OH}^{-})_{\text{added}}[/latex], pH = 7.00, as described earlier.
(d) X = 60.00 mL
pH = 14 − pOH = 14 + log([OH−]) = 14 + log(0.009091) = 11.959
Check Your Learning
Calculate the pH for the strong acid/strong base titration between 50.0 mL of 0.100 M HNO3(aq) and 0.200 M NaOH (titrant) at the listed volumes of added base: 0.00 mL, 15.0 mL, 25.0 mL, and 40.0 mL.
Answer:
0.00 mL: 1.000; 15.0 mL: 1.5111; 25.0 mL: 7.000; 40.0 mL: 12.523
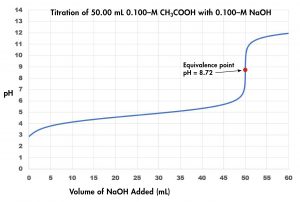
Now consider the titration of 50.00 mL of 0.100-M acetic acid (a weak acid) with 0.100-M sodium hydroxide (Figure 3) and compare the titration curve with that of the strong acid. Although the initial volumes and concentrations of the acids are the same, the pH for acetic acid, a weak acid, begins at a higher value (less acidic) and maintains higher pH values up to the equivalence point. This is because acetic acid is only partially ionized. The pH at the equivalence point is also higher (8.72 rather than 7.00) due to the presence of acetate, a weak base that raises the pH:
After the equivalence point, the two curves are identical because the pH depends only on the excess hydroxide ion in both cases.
Exercise 3: Titration Equivalence Point
This statement is true under certain conditions. Explain why the statement is true and state the conditions needed to make it true.
The weaker the acid being titrated is, the more alkaline the pH is at the equivalence point.
Example 3
Titration of a Weak Acid with a Strong Base
The titration curve shown in Figure 4 is for the titration of 50.00 mL of 0.100 M CH3COOH with 0.100 M NaOH. Ka = 1.8 × 10⁻⁵ for CH3COOH and pKa = 4.74. The reaction can be represented as
(a) Calculate the initial pH (before any NaOH solution has been added).
(b) Find the pH after 50.00 mL NaOH solution has been added.
(c) Find the pH after 25.00 mL NaOH solution has been added.
(d) Find the pH after 60.00 mL NaOH solution has been added.
Solution
(a) Assuming that the ionized concentration is small compared to 0.100 M,
(b) After 50.00 mL NaOH is added, the amount (mol) of NaOH and the amount of CH3COOH are equal. All of the CH3COOH has been converted to CH3COO–. The concentration of CH3COO– is
The equilibrium now is that for the weak base CH3COO– reacting with water
we can determine Kb from the Ka of its conjugate acid:
Denote the concentration of each of the products of this reaction, CH3CO2H and OH−, as x. Using the assumption that x is small compared to 0.0500 M:
Note that the pH at the equivalence point of this titration is significantly greater than 7.
(c) In this case, only 25.00 mL of the base solution has been introduced, and so only half of all the CH3COOH is converted into CH3COO–. The initial amount of CH3COOH is 0.05000 L × 0.100 M = 0.00500 mol, and after adding the NaOH, the amounts of CH3COOH and CH3COO– are both approximately equal to 0.005000 mol – 0.002500 mol = 0.002500 mol.
Because the solution contains a weak acid and its conjugate base, this is a buffer solution. In fact, for much of the titration when the amount of the added base is smaller than the original amount of the acid and the equivalence point has not been reached, the solution is a buffer. Thus, we can use the Henderson-Hasselbalch equation to calculate pH:
Hence, pH = pKa at the halfway point in a titration of a weak acid.
(d) After 60.00 mL NaOH is added, the amount of NaOH is 0.06000 L × 0.100 M = 0.006000 mol. This is past the equivalence point and all the weak acid has reacted away. The excess hydroxide ions make the solution basic and we can use a stoichiometric calculation to determine the pH:
So:
Note that this result is the same as for the strong acid-strong base titration example provided, since the amount of the strong base added moves the solution past the equivalence point.
Check Your Learning
Calculate the pH for the weak acid/strong base titration between 50.0 mL of 0.100 M HCOOH(aq) (formic acid) and 0.200 M NaOH (titrant) at the listed volumes of added base: 0.00 mL, 15.0 mL, 25.0 mL, and 30.0 mL.
Answer:
0.00 mL: 2.37; 15.0 mL: 3.92; 25.00 mL: 8.29; 30.0 mL: 12.097
D37.3 Acid-Base Indicators
Certain organic substances change color in dilute solution when [H3O+] reaches a particular value. These substances, either weak organic acids or weak organic bases, are called acid-base indicators, and can be used to determine the pH of a solution. For example, phenolphthalein is colorless in an aqueous solution with [H3O+] > 5.0 × 10⁻⁹ M (pH < 8.3), and turns red or pink when pH > 8.3.
The equilibrium in a solution of the acid-base indicator methyl orange, a weak acid, can be represented by an equation in which we use HIn as a simple representation for the complex methyl orange molecule:
The anion of methyl orange, In−, is yellow, and the nonionized form, HIn, is red. When we add acid to a solution of methyl orange, the increased hydronium ion concentration shifts the equilibrium toward the nonionized red form, in accordance with Le Châtelier’s principle. If we add base, we shift the equilibrium towards the yellow form. This behavior is analogous to the action of buffers.
An indicator’s color is the visible result of the ratio of the concentrations of the two species, In− and HIn. If most of the indicator is present as In−, then we see the color of the In− ion: yellow for methyl orange. If most is present as HIn, then we see the color of the HIn molecule: red for methyl orange. We can rearrange the equation for Ka and write:
When [H3O+] = Ka, the ratio of [In−] to [HIn] is equal to 1, meaning that 50% of the indicator is present in the red form (HIn) and 50% is in the yellow ionic form (In−), and the solution appears orange in color. When [H3O+] increases to 8 × 10⁻⁴ M (pH = 3.1), the solution turns red. No change in color is visible for further increase in [H3O+]. At [H3O+] = 4 × 10⁻⁵ M (pH = 4.4), most of the indicator is in the yellow ionic form, and further decrease in [H3O+] does not produce a visible color change. The pH range between 3.1 (red) and 4.4 (yellow) is the color-change interval of methyl orange; the pronounced color change takes place between these pH values.
There are many different acid-base indicators. Their color changes have a wide range of pH values (Figure 4). Universal indicators and pH paper contain a mixture of indicators and exhibit different colors at different pH values.
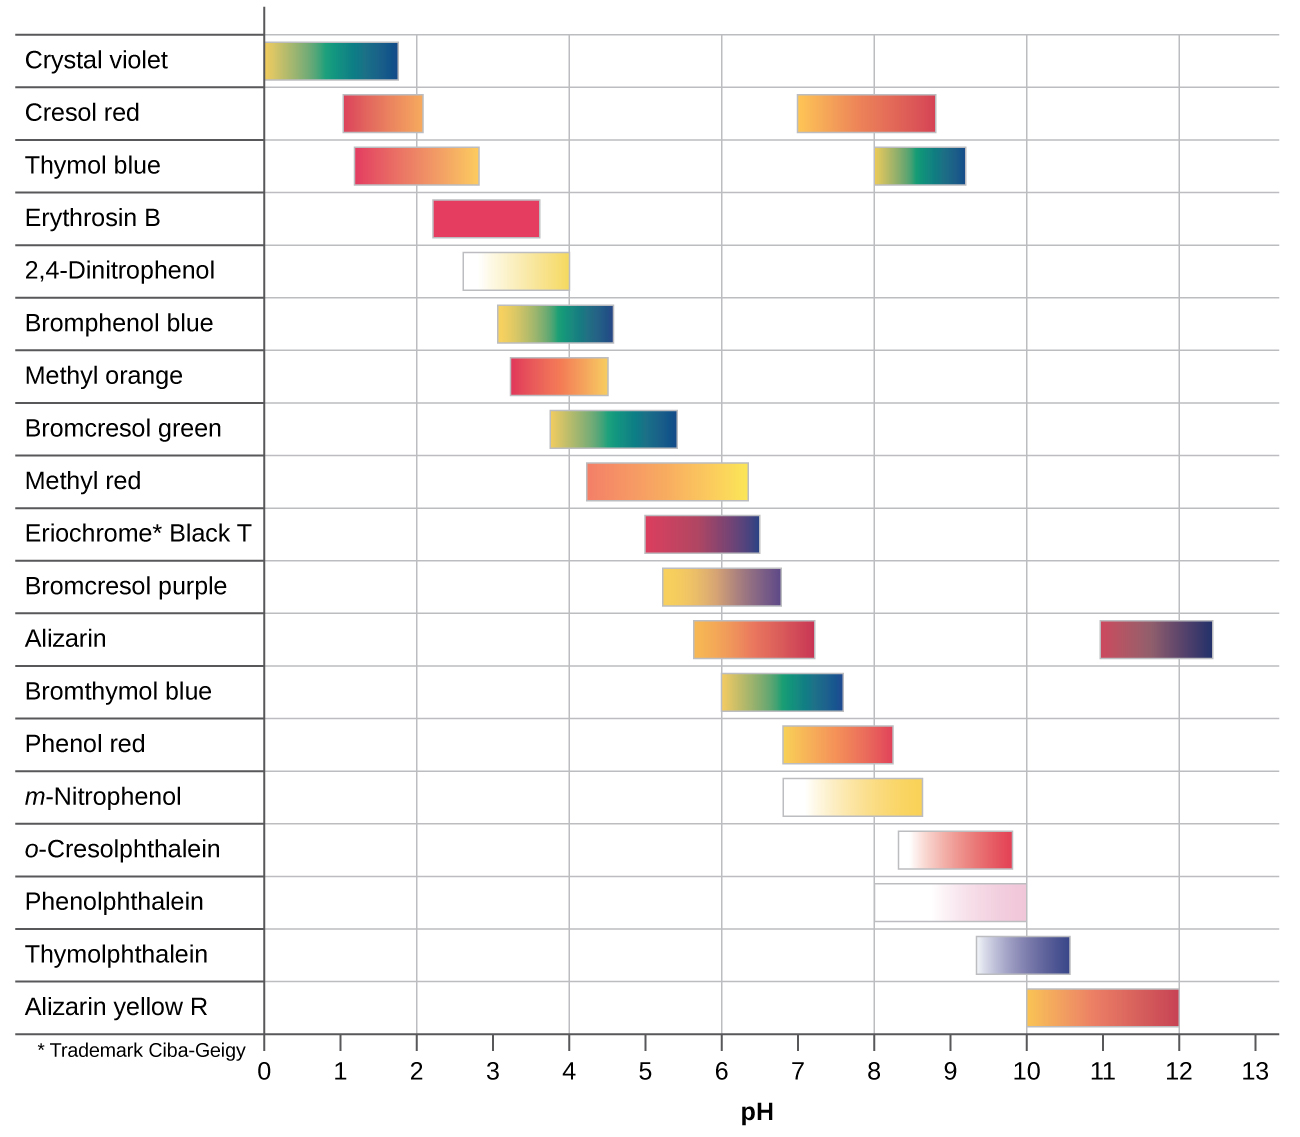
Titration curves can help us in selecting an indicator that will provide a sharp color change at the equivalence point. The best selection is an indicator with a color change interval that brackets the pH at the equivalence point of the titration.
The color change intervals of three indicators are shown in Figure 5. The vertical parts of the titration curves of both the titration of HCl and of CH3COOH are located in the color-change interval of phenolphthalein. We can use it for titrations of either acid with strong base.
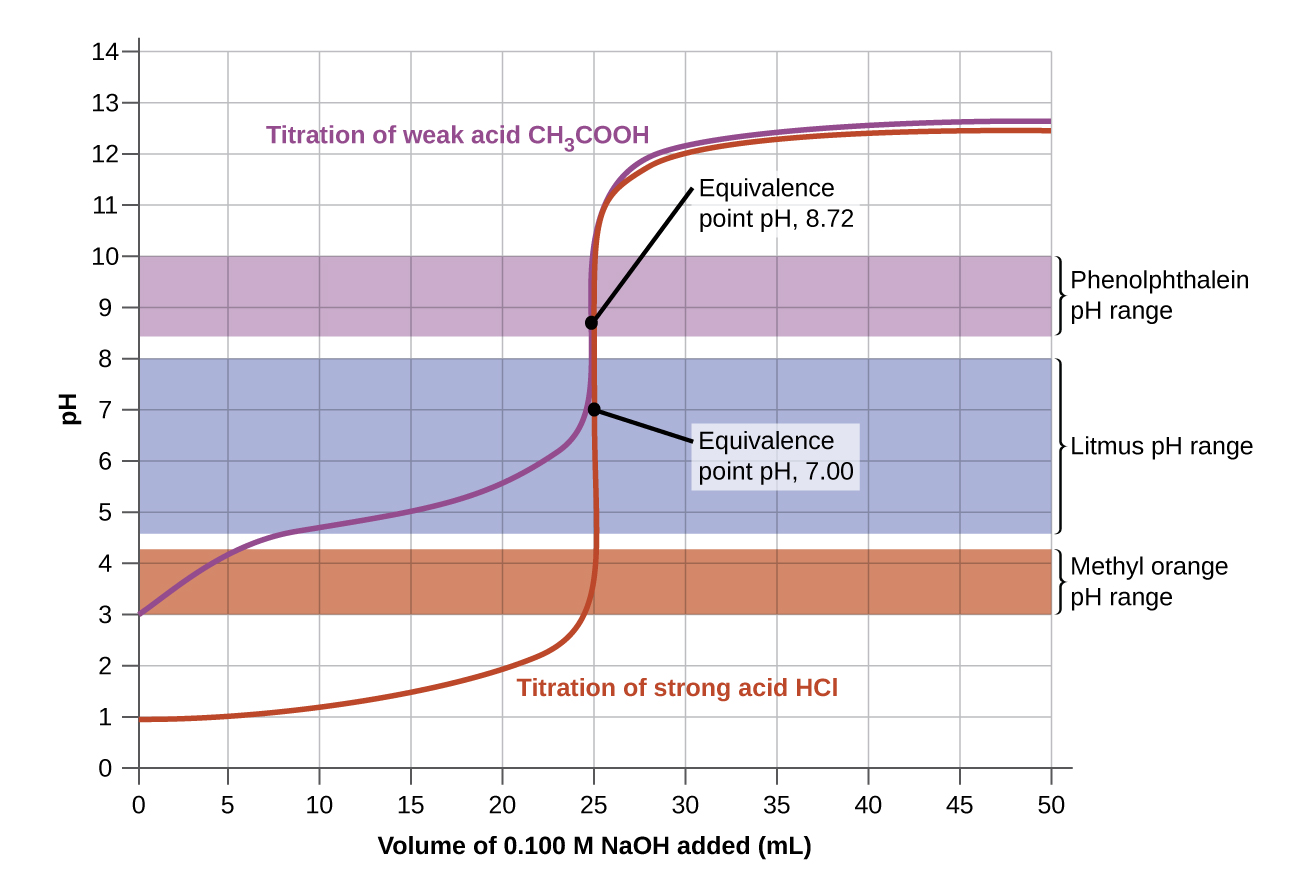
Litmus is a suitable indicator for the HCl titration. However, we should not use it for the CH3COOH titration because the pH is within the color-change interval of litmus when only 12 mL of NaOH has been added, and it does not leave the range until 25 mL has been added. The color change would be very gradual, taking place during the addition of 13 mL of NaOH, making litmus useless as an indicator of the equivalence point.
We could use methyl orange for the HCl titration, but it would not give very accurate results: (1) It completes its color change slightly before the equivalence point is reached (but very close to it, so this is not too serious); (2) it changes color, as Figure 5 shows, during the addition of nearly 0.5 mL of NaOH, which is not so sharp a color change as that of litmus or phenolphthalein. Additionally, the color change, from yellow to orange to red, is not as visually distinct as the colorless to pink change of phenolphthalein. Methyl orange would be completely useless as an indicator for the CH3COOH titration. Its color change begins after 1 mL of NaOH has been added and ends when about 8 mL has been added. The color change is completed long before the equivalence point is reached and hence provides no indication of the equivalence point.
We can also base our choice of indicator on the calculated pH at the equivalence point, which the pH of a solution of the salt resulting from the titration.
D37.4 Equilivalence point and midpoint
The equivalence point of a titration is where the amount (mol) of titrant added is in the stoichiometric mole ratio to the amount of solution being titrated. The midpoint of a titration is when we have added half the volume of titrant needed to reach the equivalence point. Suppose we are titrating a weak acid with strong base. At the midpoint, the pH of the solution equals the pKa of the weak acid because we have added half the amount of strong base needed to react with all the weak acid. Therefore, half the weak acid has been converted to its conjugate base and half is unreacted and the concentrations of weak acid and conjugate base are equal. According to the Henderson-Hasselbalch equation,
[latex]\text{pH} = \text{p}K_{\text{a}}\;+\;\text{log}\dfrac{(\text{initial concentration of weak base})}{(\text{initial concentration weak acid})}[/latex]
Because the solution is a 50:50 mixture of weak acid and weak base,
pH = pKa + log(1) = pKa + 0 = pKa
D37.5 Titration of Polyprotic Acids and Bases
When a weak polyprotic acid is titrated, there is more than a single equivalence point. For example, when H2SO3 is titrated with NaOH, there are two equivalence points because there are two acidic H atoms that can be removed from the H2SO3 molecule. There are also as many midpoints as there are equivalence points.
When a strong monoprotic base is added to a solution of a polyprotic acid, the neutralization reaction occurs in stages. The most acidic group is titrated first, followed by the next most acidic, and so forth. If the pKa values are separated by at least three pKa units, then the overall titration curve shows well-resolved “steps” corresponding to the titration of each acidic proton.
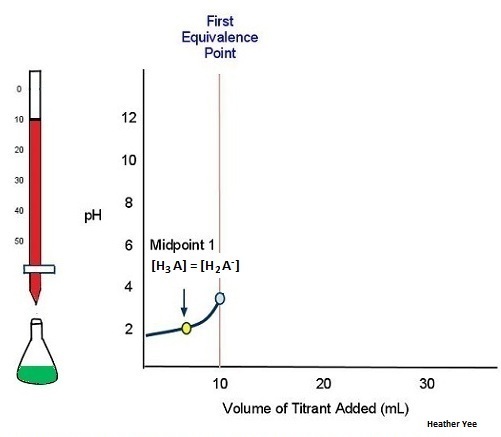
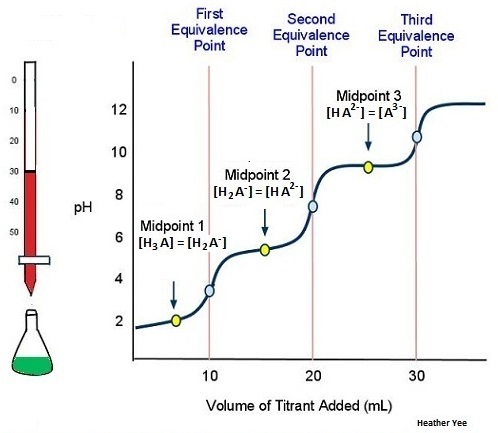
As an example, consider the titration of a generic weak polyprotic acid H3A with NaOH. Because there are three acidic protons in H3A, there should be three equivalence points. Figure 6 shows the titration curve up to the point where 1 mol NaOH has been added per mole of H3A in the solution being titrated. That is, up to the first equivalence point. The equilibrium involved is
H3A(aq) + H2O(l) ⇌ H3O+(aq) + H2A−(aq)
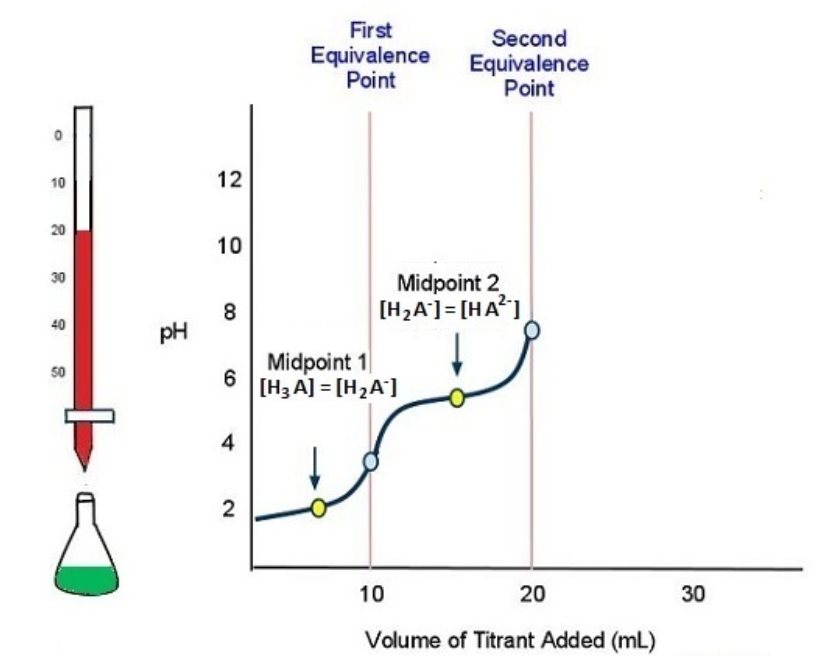
As more titrant is added, the titration curve crosses another midpoint and reaches the second equivalence point (Figure 7):
H2A−(aq) + H2O(l) ⇌ H3O+(aq) + HA2−(aq)
The titration is finally complete when all three equivalence points have been reached (Figure 8).
HA2-(aq) + H2O(l) ⇌ H3O+(aq) + A3−(aq)
Even though an acid has two or more ionizable protons it is not always possible to detect all of the equivalence points. An actual titration of the triprotic acid H3PO4 with NaOH is illustrated in Figure 9. It shows two well-defined steps: the first midpoint corresponds to pKa,1, and the second midpoint corresponds to pKa,2. Because HPO42− is such a weak acid, pKa,3 has such a high value that the third step cannot be resolved using 0.100 M NaOH as the titrant.

The titration curve for the reaction of a polyprotic base with a strong acid is the mirror image of the curves shown above. The initial pH is high; as acid is added, the pH decreases in steps if the successive pKb values are well separated.
Podia Question
Draw the structure of the amino acid alanine at pH = 2.
Sketch a titration curve for titration of a solution of alanine starting at pH = 2 and ending at pH = 13. The concentration of alanine is 0.100 M and there is 25.00 mL initially, at pH = 2. This solution is titrated with 0.100-M NaOH. pKa values for alanine are 2.85 and 9.87. No calculations are required, but the curve should be as accurate as possible.
Label each midpoint with the volume and pH. Explain why the midpoints have the pH values you used for the labels.
Two days before the next whole-class session, this Podia question will become live on Podia, where you can submit your answer.
