
Lab 7: BACKGROUND
Overexpression in E. coli
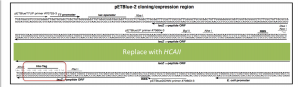
The pETblue2 vector you cloned HCAII in previous labs contains a part of the lac operon that allows regulation of protein expression from this vector. The vector contains sequences encoding the gene of interest (HCAII in the case of this lab), the lac operator and the repressor that binds to the operator and prevents unwanted transcription of the gene.
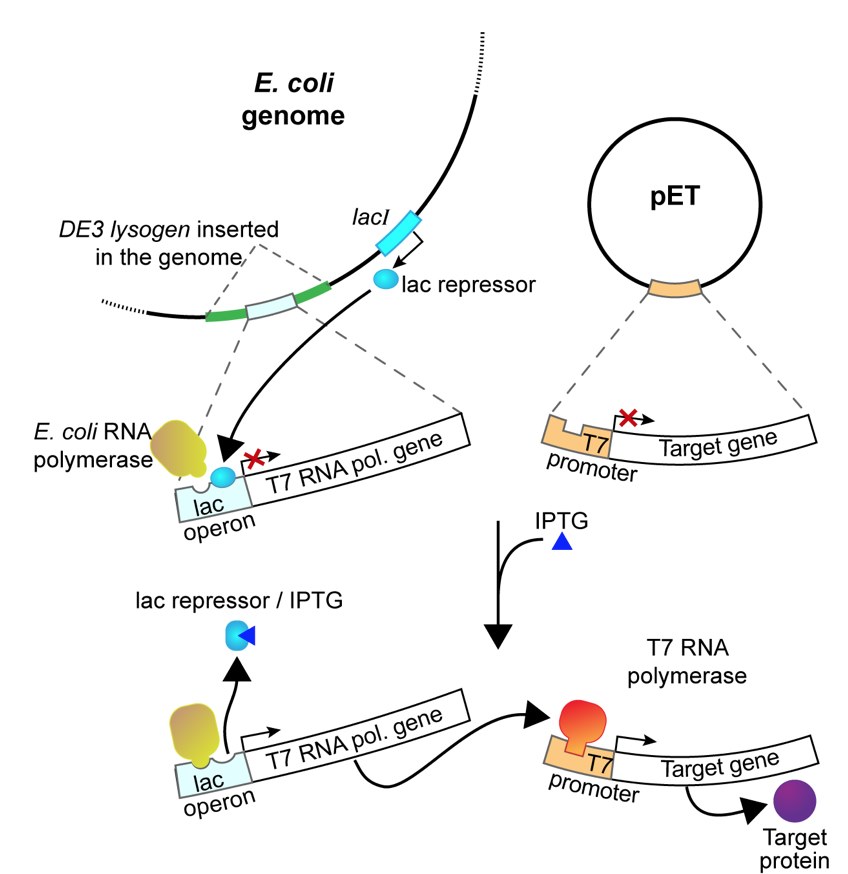
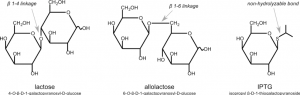
In this experiment, you will use isopropyl-1-thio-β-D-galactopyranoside (IPTG), a commonly used inducer for the lac operon, to induce HCAII expression from our clones. Unlike allolactose, the natural inducer of the lac operon, IPTG cannot be metabolized and will thus induce the operon to a higher level. IPTG is often used to induce expression of many different recombinant proteins in E. coli. In our case, IPTG will be used to induce the expression of T7 RNA polymerase, which will then transcribe the His-tagged HCAII gene you cloned into pET-blue2. These RNAs will then be translated into His-tagged HCAII protein.
Cell Growth
When inducing E. coli to overexpress protein, it is important that cells are grown to a relatively high density before the induction. Once the E. coli begin to overexpress HCAII, their growth is expected to slow down significantly. This is because the cells are devoting much of their energy to producing protein, rather than cell division.
The following video contains more information on bacterial cell growth, how to measure it, and what it means for protein overexpression:
Note that there are additional videos from Christine in the Protocol section, demonstrating several techniques mentioned here.
Purification Step 1: Cell Lysis
Cell lysis is a process for disrupting cells in order to release the contents (like HCAII!) out of the cells
There are a number of methods for cell lysis (see lecture!); in lab we will use the Bugbuster reagent
-
- Works by using lysozyme and lipases/detergents to dissolve the cell membrane
- This is the most ‘gentle’ method of cell lysis, but also the most expensive (only the best for 551 students)
Purification Step 2: Bulk Purification
Bulk purification steps are quick and easy methods to remove a number of contaminants from a sample.
In our case, we will use centrifugation to separate soluble protein from cell debris.
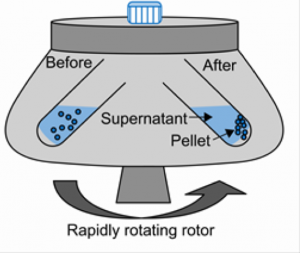
- Soluble fraction (i.e. supernatant, lysate) contains:
- Soluble proteins
- Small molecules
- Insoluble fraction (i.e. pellet) contains:
- Cell wall/membranes
- Insoluble proteins
- Unlysed cells
Purification Step 3: Fine Purification (chromatography)
See lecture for more details on the different types of chromatography methods! Here is a list of the most commonly used types of chromatography for protein purification:
- Size – size exclusion
- Charge – ion exchange
- Specific interactions – Affinity (our method of choice!)
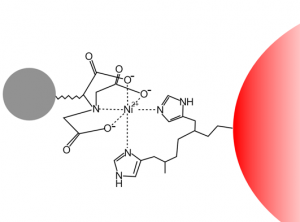
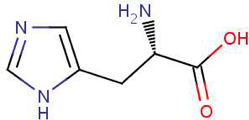
- Remember that we added a histidine-tag to HCAII when we cloned into pETblue2 (see picture below)
- We will now use this histidine-tag for affinity purification
Purification Methods: His-Tag
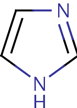
Since you cloned the HCAII gene such that your HCAII protein has a His-tag at the C-terminus, you can use nickel resin to purify the protein. The histidines coordinate with nickel ions in the resin, as seen below, effectively gluing your protein to the column. Imidazole, which is chemically similar to histidine, can be used to outcompete protein bound to the nickel resin and thereby specifically elute the desired His-tagged protein. Washing the column with buffer containing a low concentration of imidazole first should remove most of the contaminating protein (i.e. proteins that bind weakly to the nickel resin). The His-tagged protein can then be eluted with a higher concentration of imidazole.
Purification Step 4: Identifying Purified Protein
After running a column, you are left with a number of elution fractions, only some of which contain the protein of interest. You will test each elution fraction for the presence of protein using the NanoDrop spectrophotometers.
Just like in previous labs, we will use the NanoDrop spectrophotometers to measure absorbance values at 230, 260 and 280 nm. Because we are now interested in protein rather than nucleic acid, we will primarily use the absorbance at 280 nm, or A280. Also be sure to note the 260/280 ratio, as a measure of purity.
We can use Beer’s Law to determine the protein concentration from the A280. Beer’s Law states:
A = elc
Where:
- A is the absorbance
- e is the molar absorbtivity, also known as the extinction coefficient
- l is the pathlength (1 cm in our system), and
- c is the concentration
The extinction coefficient is characteristic for a particular substance. It can be estimated from the sequence of a protein using the equation:
e = (#tryptophans x 5500) + (#tyrosines x 1450)
The experimentally determined extinction coefficient for HCAII is 50,420 cm-1M-1.
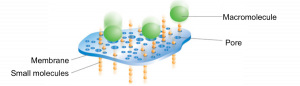
Purification Step 5: Dialysis
The dialysis process is commonly used for removing salt or small molecules (like imidazole!) from protein samples. It works by separating molecules according to size through the use of a semi permeable porous membrane. Pores in the membrane allow solvents, salts, and small metabolites to defuse across but block larger molecules.
Dialysis requires:
- A large (>100x) excess volume of dialysis buffer compared to the sample
- Time to equilibrate (>4 hours with stirring). Note that this is an equilibration. The imidazole concentration in your protein sample after dialysis is not exactly 0, but it is very low.
- Multiple changes of dialysis buffer
