
Lab 8: DATA ANALYSIS
Download your gel results here: Results: Lab 8
You will use these gel images to determine Relative Mobility (Rf), or the ratio of the distance a band of interest migrated compared to the distance the dye front migrated.
Start by measuring the distance from the top of the resolving gel to the edge of the dye front. The edge of the dye front should appear as a faint line towards the bottom of the gel, and is the farthest that anything could have run on the gel. This can be difficult to see, so estimate if necessary. This value will be the denominator in each Rf calculation below.

Now measure the distance from the top of the resolving gel to each of the MW ladder bands. Divide each of these by the total length of the resolving gel, as measured above, to calculate Rf.
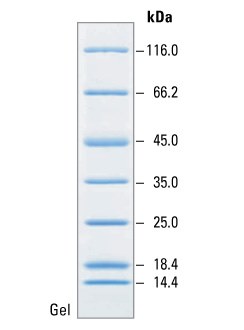
The masses of each band in the MW ladder are shown above. Use this information to create a mass calibration curve by plotting Rf on the x-axis and log(MW) on the y-axis. If any points appear to be outside the linear range, you can discard them. Add a best-fit line and be sure to show the equation, as shown in the image below.
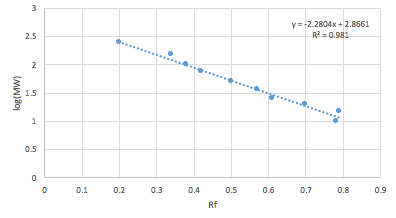
Use this equation to determine the apparent molecular weight of any other bands of interest. Measure the migration distance of such bands and calculate the Rf, then plug into the equation to determine the apparent MW.
