
Lab 8: BACKGROUND
SDS-PAGE: The Gels
Gel electrophoresis is a powerful separation technique used for analyzing many biologically important molecules, including both proteins and nucleic acids. We have already used electrophoresis to examine DNA molecules, and now we will study proteins using a particular type of gel electrophoresis called SDS-PAGE:

This type of electrophoresis relies on two components that allow proteins to run predictably through the gel:
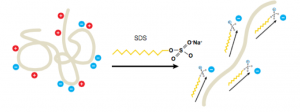
- Sodium dodecyl sulfate (SDS) is a denaturing detergent. It binds proteins non-covalently and unfolds them. It also coats proteins with a uniform negative charge, creating a linear protein with a constant charge:mass ratio
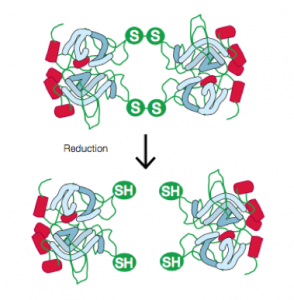
- A reducing agent, β-mercaptoethanol (BME), is also required to break disulfide bonds and ensure proteins are fully linearized.
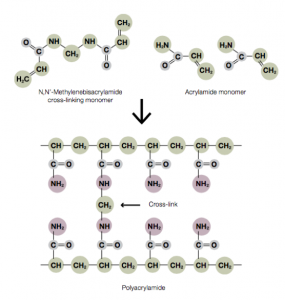
The gel itself is made of acrylamide. A cross-linker, typically bis-acrylamide, is polymerized along with the acrylamide using free radicals to create a network of pores:
Our SDS-PAGE gels will have two layers (click on the plus signs to read about each):
For more on SDS-PAGE, see the Appendix: Appendix 3: Additional laboratory details
Visualizing Proteins in an SDS-PAGE Gel with Coomassie Blue
Once you load and run your samples through the gel, you will need to stain your samples in order to visualize the proteins. You will stain with a dye called Coomassie Blue. This is a dye that binds primarily to aromatic and positively-charged residues, making proteins appear blue in the gel.

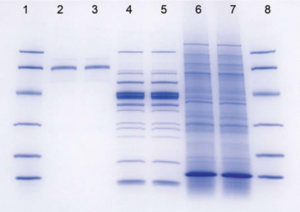
Once you have stained your gel, you will need to calculate the molecular weight (MW) of any bands of interest, including HCAII. One way to determine the MW of unknown samples is to compare the unknown’s relative mobility (Rf) with that of MW standards.
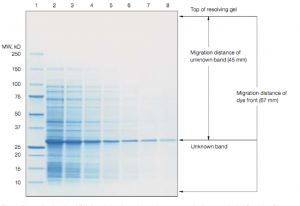

If you plot the Rf of the standards vs. the log of their MW, you should get a straight line for those standards that are in the linear range for the gel. You can then use this standard curve to determine the apparent molecular weight of any protein band on the gel, so long as the band falls within the linear range of the standards. Whether or not a particular size protein is within the linear range of the standard depends on the percentage acrylamide in the gel you are using. For this lab, we will tell you what percentage to use so that HCAII falls within the linear range.
Please see the Data Analysis section, which follows the Lab 8 Procedure, for more information on this topic.
