
Lab 1: PROCEDURE Part 1
NOTE: Before lab, you are expected to read through the procedure instructions. You should be familiar with what you will be doing before lab starts.
NOTE: The instructions for this lab were written for a Mac. However, PyMOL is virtually identical on a PC, so we don’t anticipate any problems.
NOTE: The times in parentheses are approximate suggestions of how much time it should take to complete the tasks. Ideally, this lab can be completed in about three hours.
PART 1: GETTING FAMILIAR WITH PROTEIN STRUCTURE (45 min)
Explore the PDB site (5 min)
- Go to the PDB website (link opens in a new tab): Protein Data Bank
- In the search box at the top of the page you can type the name of any protein you like in the search box, or you can use the “PDB code”, a code of four alphanumeric characters that defines a structure. If you don’t know what to type try, for example, carbonic anhydrase.
- You will get a list of results. Click on one of them and you will find its description page, including the Primary Citation (the paper where the crystallography was presented), the Molecular Description (the name of the protein and its classification), and possible ligands.
- Under the picture you’ll find the Experimental Details, which include the resolution (<1.5 Å: very high; <2 Å high; <2.5 Å medium), space group (the geometry of the crystal), R-value and R-free (quality control numbers; generally these should be ~10% of the resolution or less).
- The PDB code (e.g. “3IEO”) is in the top-right corner.
- Try a number of searches for proteins that you have studied. Note down the PDB code to open them in PyMOL later.
Visualize proteins with PyMOL (15 min)
- Open PyMOL.
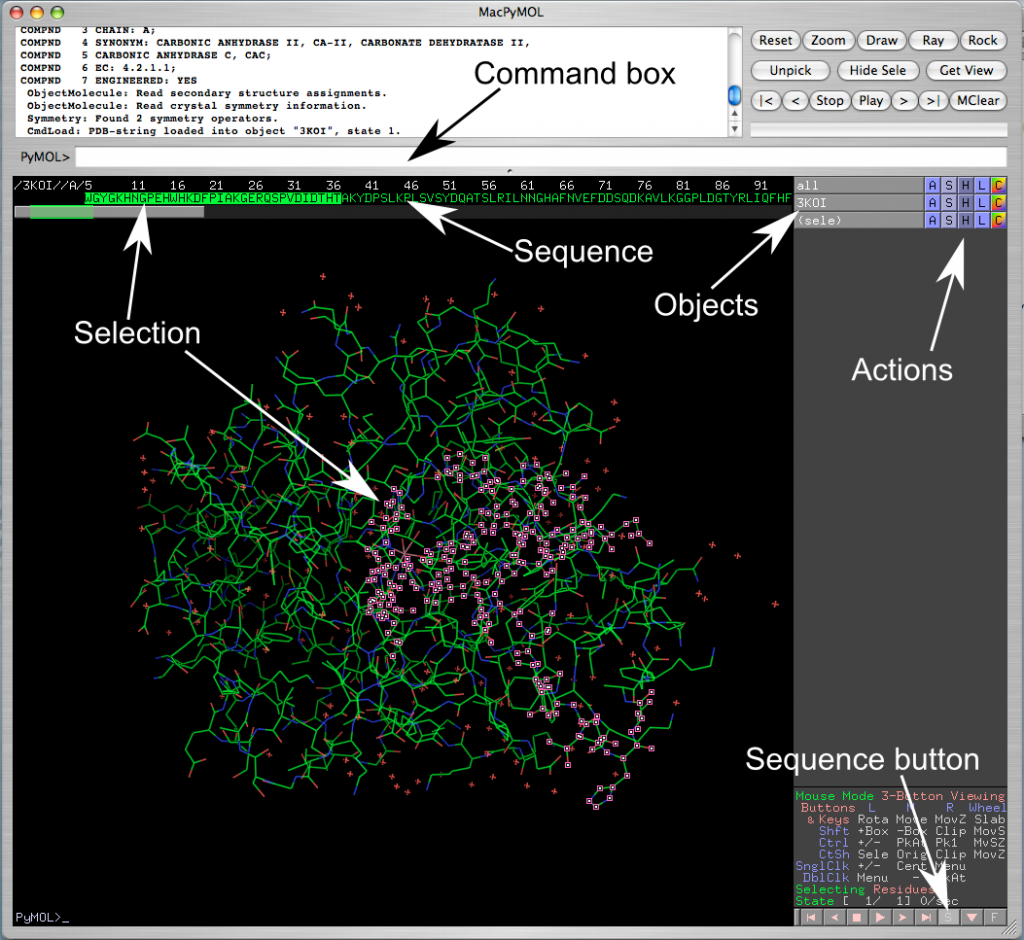
- Note the tool bar on top, the menus, and the command text box underneath them (next to the “PyMOL>”). (See figure 1.1). Typing a command in the command box can perform many of the functions.
- Type in the command “fetch <pdb code>” (e.g. “fetch 3IEO”). This will download the structure from the PDB web site and the protein will appear in the main portion of the screen.
- Using the mouse:
- Clicking on the background and moving the mouse will rotate the molecule around the X and Y axes (clicking at the edge of the screen will rotate around Z axis).
- Clicking on the molecule will select residues (or chains, or atoms, depending on the current mode).
- Right click will zoom in or out on the molecule (move mouse up and down).
- The middle button can be either clicked or rolled.
- Clicking the middle button will allow you to move the structure sideways (translation).
- Rolling the mouse wheel will slice away Z-planes (you’ll see only a slice of the protein), a good way to focus only on some details of the protein.
- Objects: In the right panel you will see two or more objects: all, one or more <pdb code>(i.e. 3IEO), and possibly some selections ‘(sele)’. You can click on these buttons to display or hide molecules without deleting them (light grey buttons are displayed, dark grey buttons are hidden).
- Next to them there are five buttons: A, S, H, L, C
- A stands for action; you can zoom, center, rename, delete, and duplicate objects from this menu
- S stands for show; here you can change the representation of the molecules: e.g. line, cartoon, or stick.
- H stands for hide, it performs the same functions as S except that it hides whatever selection you make.
- L stands for label
- C stands for color: here you change to a specific color, color by chain, by secondary structure, or color by rainbow. Coloring by spectrum/rainbow highlights visually the N- and C-termini of the protein. If you use color by chain/rainbow each chain will have its own rainbow spectrum and it will be easy to see where they start and end.
- Selecting parts of the protein with commands:
- To select a chain type in the command box ‘sele chain A’
- To select an amino acid name ‘resn’, type ‘sele resn LEU’
- To select a residue by number (‘resi’) and chain, type ‘sele chain A and resi 74’
- You can also use the ‘or’ operator for complex logic: ‘sele resi 74 or resn LEU’ will select residue number 74 and all the Leu in the protein
- Once you enter a selection, the corresponding residues become highlighted and you can perform an action with the ASHLC buttons next to ‘(sele)’ in the object box
Play with the visualization modes (10 min)
Experiment with different proteins to familiarize yourself with PyMOL.
- Load the structure, display it in both cartoon and line representations, and color by chains to show the individual subunits.
- Change the PyMOL background color to white (this will make things easier to print): Click on the Display drop-down menu; click Background; choose White.
- Open the sequence display (the little square S button in the bottom-right corner, near some controls that look like VCR control buttons, play, stop, etc.). The sequence will show on the top.
- Find a tryptophan in the protein, if there is one: check the sequence for a W, left click on it to select it, and then in the right panel under the ‘sele’ button use the A button to zoom in on this atom. Use the S button to show the side chain in “sticks”. If there is no Trp, try Tyr (Y).
- Use the middle button scroll to adjust the visible slab of the molecule (this takes the stuff in the foreground and in the background away and let you focus on the details)
- Repeat for phenylalanine (F). Once zoomed in, let’s display the whole structure in lines, (use the show button); now try displaying in sphere representation.
- Hide the sphere representation and display just the phenylalanine side chain in sphere.
- To help see the side chains beneath the spheres, go to settings in the above tool bar, then transparency, then spheres, then 60%.
- Hide spheres, then select any residue, zoom in, and only for this residue display dots; this is a convenient way to see space filling models of single amino acids.
- Zoom out of the structure, then display the whole molecule as ‘surface’; from the S button. Another way to view this is show as mesh surface.
Practice following a fold with the structure of a TIM barrel (10 min):
- Remove all the unneeded PDBs from the object box (A->delete object).
- Download a TIM barrel, a very common enzyme fold. Fetch 1TRI (an engineered monomeric triose isomerase).
- The TIM barrel (so called because it was first identified in Triose IsoMerase) has an α/β fold, with a central parallel β-barrel (a β-sheet that closes into itself) and α-helices on the outside.
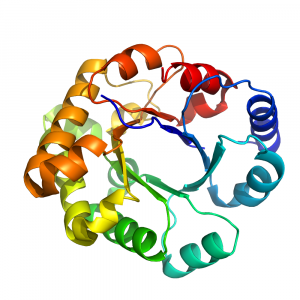
- Display by cartoon, color by rainbow, such as in Fig. 1.2, and follow the fold. You will observe a series of inner β-strands, loops, and α-helices that repeat 8 times, forming an inner β-barrel surrounded by helices.
- Note that if you display the structure in sphere, you’ll see that the center of the β-barrel is not empty.
- The active site is at the “mouth” of the β-barrel.
- Familiarize yourself with the fold.
- Now delete 1TRI and fetch 2X2G. This protein has two molecules in the asymmetric unit (in is not a biological dimer but it crystallizes as a pair).
- Display the protein in cartoon.
- Show the surface of the entire molecule (do not turn off the cartoon).
- Set the surface transparent (menus Setting/Transparency/Surface/60%)
- Now select the ligand: command ‘sele resn 3PG’
- Show the selection (the ligand) in spheres
- Zoom into the ligand (Action Zoom next to ‘(sele)’) and examine how the ligand fits into the cavity of the active site.
- Save an image:
- Selecting the button “Draw/Ray” in the top right corner
- Select Draw (fast)
- Select Save Image to File and name the file
- NOTE: Generally, when using images in lab reports, you will be required to ray-trace the image (more on that later). To save images for yourself for future reference, however, this quicker drawing approach is fine.
