
Lab 1: PROCEDURE Part 2
PART 2: VISUALIZATION OF HUMAN CARBONIC ANHYDRASE II (30min)
- Close and reopen PyMOL to start fresh.
- Change the background to white.
- Download 2VVA. This is a structure of HCAII with CO2 in the active site.
NOTE: The numbering of HCAII residues is not the logical 1–260 consecutive sequence that one would expect. Because a lot of work was done on HCAI, which has an extra residue, HCAII is numbered with a gap at position 126:
…Asn 124, Thr 125, Lys 127, Tyr 128…
Thr 125 and Lys 127 are consecutive in the sequence and connected to each other (please verify that in PyMOL). The gap is a numbering convention for convenience in discussion, so that the active site residues in HCAI and HCAII have the same residue number.
- Hide everything and show the protein in cartoon. Color it by spectrum/rainbow.
- Show the sequence.
- First select the catalytic atoms, the Zn2+ and the zinc-bound hydroxyl group. Type the command: ‘sele resn ZN or resi 2350’. That is, select the residue named ZN or the residue number 2350, which happens to be the number of the water molecule bound to the zinc. (The ‘or’ ensures that both are selected.)
- Display them in sphere. You may want to rename the selection: press the A next to the ‘(sele)’, chose ‘rename selection’, call it ‘Zn-OH,’ or something else of your choosing.
- Clear the selection by clicking in a white area.
- Find in the sequence the Zn-coordinating histidines (H): H94, H96 and H119 (you could also select them with the following command ‘sele resi 94+96+119’), and display them in stick.
- Rename the selection something like ‘coorHis’.
- Show the surface of the entire molecule (do not turn off the ribbon).
- Set the surface transparent (menus Setting/Transparency/Surface/60%)
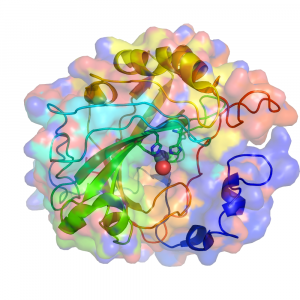
- Now, play around with the color scheme. If you use the color as it is now, as shown in Fig 1.3, it is very difficult for the viewer to see what is important in the figure. For your lab reports, you want to think about the story you want to tell with this figure, and how to draw the viewer’s attention to the important parts.
- Now, play around with the orientation of the model. You should be able to find an orientation such that you can appreciate the location of the active site. There is a clear cavity in the surface, and at the end of it there is the Zn-OH group.
- Take two pictures from different angles and/or at different zooms for your lab notebook.
- Ray trace the image for quality. Select “Draw/Ray” from the top right corner, then select “Ray (slow)”
- Then Save Image to File
- Rotate, and repeat.
NOTE: It is essential that you ray-trace any image to be included in a lab report. It is therefore a best practice to ray-trace any images you plan to save. However, some computers take an excruciatingly long time to ray-trace. If this happens to you, you may save the sessions instead and go back later to ray-trace any images you want for your report (File>Save Session).
- Now select the polar residues of the active site: Tyr (Y) 7, Asn (N) 62 and 67, His (H) 64, Gln (Q) 92, Glu (E) 106, and Thr (T) 199 and 200. First deselect everything by clicking in a black area, then type the following command: ‘sele resi 7+62+64+67+92+106+199+200’. Rename the selection ‘polar’ and display them in sticks.
NOTE: His 64 is displayed in two conformations! This is because in the crystal this side chain spends about 50% of the time toward the active site, and 50% in the other orientation. The crystallographer was able to see electron density for both conformations and fit a side chain in it. This is not unusual for high-resolution structures.
- Now select the hydrophobic residues in the pocket: Ile (I) 91, Val (V) 121 and 143, Phe (F) 131, Leu (L) 141 and 198, and Trp (W) 209: type ‘sele resi 91+121+131+141+143+198+209’.
- Now select the CO2: ‘sele resi 1264’ and save the selection as ‘CO2’. Display it in spheres.
- Now examine the structure and the residues that define the active site. Use cartoon for the backbone of the whole structure. Hide the sticks for the hydrophobic selection, and take a picture with just the polar selection for the lab report. Then, without moving the protein, hide sticks for the polar, show sticks for the hydrophobic residues and take another picture.
- Save what you have gotten so far as a PyMOL session (File>Save Session). Save the file as 2VVA.pse.
