
Lab 2: BACKGROUND
PCR
As discussed in lecture, PCR can be used to amplify segments of DNA – in this case the HCAII gene and pETblue2 vector – using small pieces of ssDNA called primers. PCR is a very powerful and widely used technique in biochemistry and many other fields because it enables specific amplification of a desired segment of DNA. PCR also enables you to introduce mutations and/or additional sequences into the DNA.
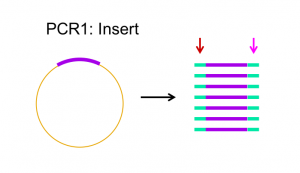
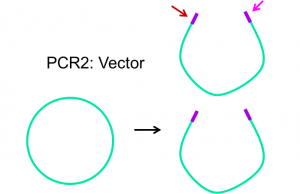
Primers are designed to complement the 3′ end of each strand of the DNA template. For Gibson assembly, primers are designed to be complementary to both the vector and insert sequence, with addition of appropriate overlap sequence (see figures 2.1 and 2.2 below). Once the primers have been designed, they can be ordered from a company that chemically synthesizes them.
Phusion polymerase is a DNA polymerase that is resistant to heat inactivation, making it able to withstand the temperatures necessary to melt/denature the DNA template for PCR.
In a typical PCR reaction there are 3 steps in each cycle:
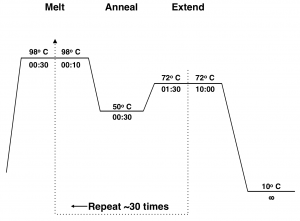
- Denature the dsDNA (double-stranded DNA) template at 94–96 ºC. (This temperature will depend on the number and type of base pairs in your template).
- Anneal the primers to the template at 50–65 ºC (This temperature will depend on the melting temperature (Tm) of your primers).
- Extend the primers at 72 ºC.
Typically this 3-step cycle is repeated 25-35 times. A final extension step of ~20 min. at 72 ºC is done to ensure that all of the PCR products are full synthesized. The thermocycler is then set to hold at 4 ºC or 10 ºC until the reaction is removed from the machine.
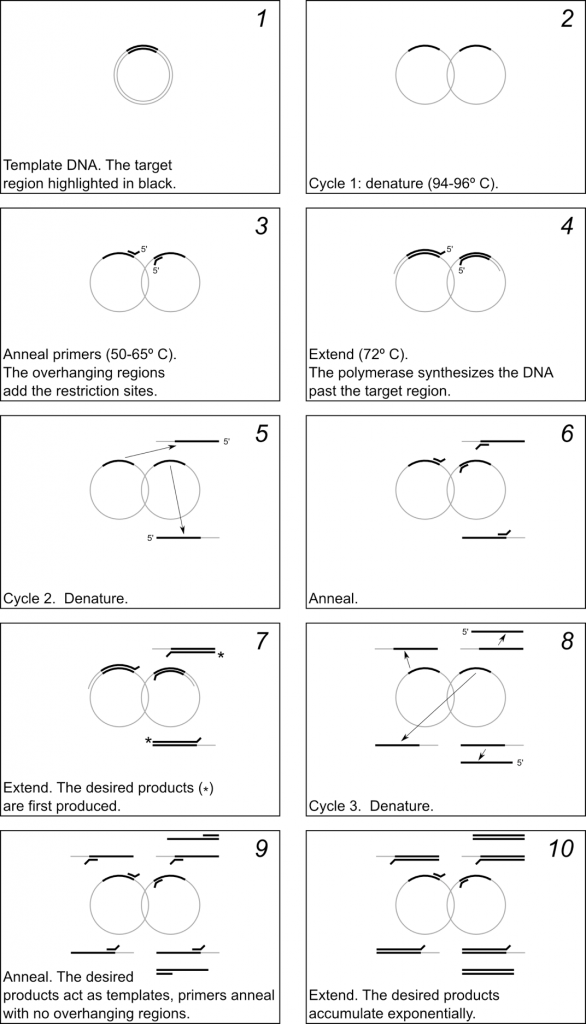
The mechanism of PCR is schematically illustrated in Fig 2.3. Figure 2.4 shows a diagram of the thermocycler program you will use in this lab period.
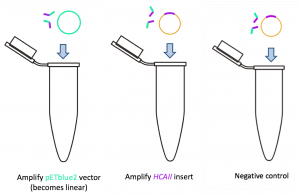
PCR Goal: Amplify HCAII insert and pETblue2 vector using primers designed for Gibson cloning
Run three PCRs:
- Amplify pETblue2 vector
- Amplify HCAII insert
- Negative control
Agarose Gel Electrophoresis
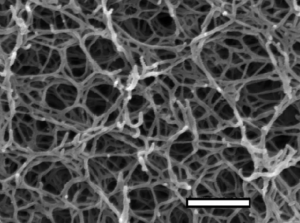
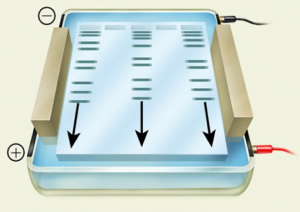
Agarose forms a porous gel, as seen in the micrograph image below. You load your DNA in the wells at the top and apply a current, forcing the charged DNA molecules through the gel. This separates the DNA by size, with the smallest DNA fragments able to migrate more quickly through the pores and running farther down the gel.
Different concentrations of agarose are used in gels depending on the relative sizes of the DNA fragments expected or the separation desired; in this experiment you will be running a 1.0% agarose gel. The molecular weight of DNA determines its rate of migration. Typically, the smaller the molecule, the faster it will migrate through a gel. However, DNA pieces of the same size can have different mobilities depending upon whether their shape is linear, circular relaxed, or circular supercoiled. Circular supercoiled DNA migrates faster than either linear or circular relaxed DNA, while linear DNA typically migrates faster than circular relaxed DNA.
Samples containing DNA are mixed with a solution containing bromphenol blue and xylene cyanol as tracking dyes; the bromphenol blue migrates at about the same rate as a 0.3–0.5 kb fragment and the xylene cyanol migrates similarly to a 4–5 kb fragment. Sucrose is also added to make the sample denser than the buffer so the sample will sink to the bottom of the well when it is loaded. Generally about 2 μL of loading dye is added per 10 μL of sample.
For additional information about agarose gel electrophoresis, please see the appendix: Appendix 3: Additional laboratory details
Preparing an agarose gel
To determine whether our PCR resulted in the desired DNA fragments that will allow us to do Gibson Assembly, we will run a small amount of the PCR product on an agarose gel.
This lab requires 1% w/v agarose gels in TAE buffer.
w/v% = weight of agarose/volume of solution
Analyzing a Gel: Ethidium Bromide Staining
Since DNA alone cannot be detected in a gel, ethidium bromide (“EtBr”), a fluorescent dye, is added to the DNA. Ethidium bromide intercalates between the bases of double-stranded DNA or RNA.
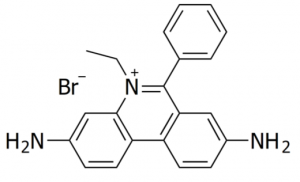
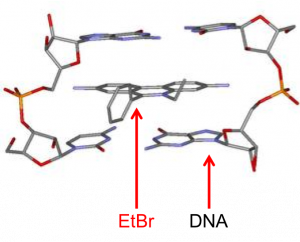
EtBr absorbs UV light at 302 nm and produces a reddish-orange fluorescence at 590 nm; the amount of this fluorescence is proportional to the mass of the DNA. Therefore, if you shine UV light on your gel, the EtBr will fluoresce, thus visualizing your DNA.
The ladder you load on your gel has bands of known size. This will allow you to estimate the size of your DNA fragments by comparison. A pdf containing information on the ladder we will be using, including the sizes of the bands, is available here (pdf opens in a new tab): NEB quick load DNA ladder
