
Lab 9: PROCEDURE
Assay overview:
Plan the experiment
Note: This section walks through how to plan the experiment. You should review this before coming to lab, but you will have time to complete the calculations with your partner in lab. There will also be a video to walk through this planning process.
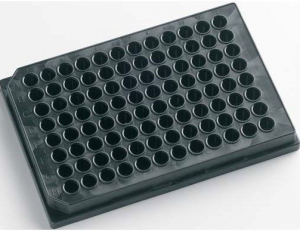
- You will be using a 96-well plate, and each well will contain a single test condition. A picture of a 96-well plate is shown below, along with a drawing that highlights the standard labeling of rows and columns:

- Create a detailed chart like the one below to keep track of the volumes of solution you are adding to each well (again, this will be completed in lab).
| Plate Row | Plate Column | Protein | Protein Stock Conc | Protein Volume | Urea stock Conc | Urea stock Volume | Protein Buffer | Final Urea Conc |
| A-B | 1 | Blank | 0 | 0 | 0 | 0 | 100 μL | 0 |
| C-E | 1 | Wt | 5 μM | 10 μL | 0 | 0 | 90 μL | 0 |
| … | ||||||||
| A-B | 2 | Blank | 0 | 0 | 0.56M | 90 μL | 10 μL | 0.5 M |
| C-E | 2 | Wt | 5 μM | 10 μL | 0.56M | 90 μL | 0 | 0.5 M |
| … |
- Organize your experiment to minimize pipetting: add the same concentration of urea in each column and add equal volumes of the same component (i.e. buffer blank or protein) to each row.
- Suggested rows: A and B – Control, C to E – wild type, and F to H – mutant HCAII
- Plan for a final volume of 100 μL per well.
- Choose final protein concentrations. The final concentration of protein in each well should be 0.8 – 2.0 µM. The higher the protein concentration, the better your data will be; however, you still need to have protein for future labs. If you have at least 1 mL protein at a concentration of 50 µM or higher (or the equivalent), use a final protein concentration of 2.0 µM. If you do not have that much protein, use a lower concentration. Talk to the teaching staff if you are not sure what to do. Note that you can use different concentrations of protein for wild type vs mutant, if necessary.
- Note: in a virtual setting, we don’t have to worry about volume of available protein, so go ahead and plan for 2.0 µM final protein concentration.
- Once you’ve decided on final protein concentrations, plan to make 500 μL stocks that are 10x concentrated. For example, for a final protein concentration of 2.0 µM, you will make a 20 µM stock.
- Refer back to lab 8 for the concentration of each of your protein stocks.
- Using a multichannel pipette, add 10 µL of this stock of wild type or mutant, or protein buffer, to the designated rows.
- The remaining volume to 100 μL will be different concentrations of urea solution. You should test 11 concentrations of urea between 0.5M and 9M (plus 0M). Figure out the volume of urea you can add to each well, and then what urea stock concentrations you want to use.
- Test each urea concentration in triplicate.
Prepare solutions
- You will be provided with 10 mL of 10M urea in protein buffer. Use this stock urea solution to make several 1 mL dilutions in Protein Buffer, creating the stock solutions you planned in your chart. Again, you should test 11 concentrations between 0.5M and 9M.
- Create the stocks of wild type and mutant protein, as you planned above. For most people, these will be 500 μL stocks at 20 µM.
Assemble the experiment
- Begin by using a multichannel pipette to add 10 µL protein buffer to rows A and B, and 10 µL protein stock to the remaining rows (wild type in C-E and mutant in F-H).
- Next, use the mulitchannel to pipette the appropriate urea solution into each column. Conduct pipetting with increasing urea concentrations and rinse/dry the reservoir prior to adding the next stock.
- Be careful not to create bubbles when pipetting.
- Cover your plate with labeled plastic wrap and incubate at room temperature for 60-90 minutes.
Assembling an unfolding experiment in a 96-well plate
- The following video demonstrates how to use multichannel pipettes to set up a 96-well plate:
Read the fluorescence
- Use the plate reader to excite at 280nm and measure emission from 310nm-370nm in each well.
- The following video shows how to operate the plate reader:
