
Lab 9: BACKGROUND
As you experienced with albumin, it is not very difficult to denature proteins. In a research setting, we want to denature proteins in a more controlled, quantitative way so that we can gain insight into the thermodynamics of protein unfolding, which can tell us about the stability of the protein. To quantitatively measure protein denaturation of HCAII we will take advantage of two biochemical phenomenon: chemical denaturation and fluorescence spectroscopy.
In the case of boiled egg whites, the proteins were denatured, but then formed larger bond networks that knitted many proteins together, causing the change in color and firmness. In contrast, when denaturing proteins in a research setting, chemical denaturants called chaotropes (ex. urea and guanidinium HCl) are used. These agents essentially outcompete for hydrogen bonding to water, thereby weakening the hydrophobic effect to the point that proteins no longer fold. These agents also prevent the formation of larger aggregates, resulting in fully denatured protein molecules floating freely in solution. In 551 lab, urea will be used to incrementally reduce the fraction of folded HCAII in a sample at room temperature, in such a way that the fraction of folded and unfolded proteins can be measured, enabling thermodynamic analysis of protein stability (Bennion and Daggett, 2003).
To measure how much folded and unfolded protein is in each sample, we will use fluorescence spectroscopy. This is a technique used to measure a fluorescent signal inherent to fluorescent molecules. When a fluorophore absorbs a specified wavelength of light, its electronic state is excited to a higher energy state. The higher state subsequently drops in electronic state, which coincides with emitting photons at a lower energy wavelength (Figure 9.2).
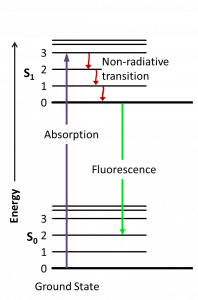
Fluorimeters can detect this emitted wavelength, which can then be used to infer various properties of the fluorophore and of its surroundings. This technique can be applied to study, for example, protein stability, enzymatic activity, and ligand binding. Advantages of this technique include the ability to use a wide range of experimental conditions, the requirement for a small amount of sample, and the ability to detect fast changes.
In this lab, we will exploit the fact that a fluorescent amino acid (tryptophan) emits fluorescence at a different wavelength depending on whether the protein is folded or unfolded. Because tryptophan is already present in protein, we refer to this phenomenon as “intrinsic fluorescence” (to differentiate from a case where a fluorophore has been added chemically to a protein). This intrinsic protein fluorescence due to tryptophan is observed when the protein is excited at 280nm and its emission is observed at a different wavelength (e.g. 310nm-370nm).
HCAII contains seven tryptophans; you examined them during Lab 1. Tryptophan fluorescence depends on the polarity of the environment surrounding the tryptophan and can therefore indicate changes in the structure of the protein (Muino and Callis, 2009). Upon denaturation, the Trp fluorescence spectrum shifts to longer wavelengths and the fluorescence intensity decreases because the tryptophan residues – which are mainly buried inside the protein – become exposed to the more polar environment of the protein buffer (Fig 9.3). We can use this change to determine how much protein is folded in a sample.
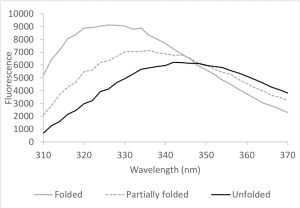
A simplified view of protein folding assumes that the protein will occupy either a completely folded or unfolded state (this view applies to most smaller, globular proteins, such as HCAII). Exposure to increasing concentrations of a denaturing agent, such as urea, gradually increases the amount of unfolded protein in the sample. This change, in turn, gradually shifts the emission spectrum from one that is typical of a folded protein (grey curve in figure 9.3) to one that is typical of an unfolded protein (black curve). We can plot this change and obtain a sigmoidal denaturation curve, i.e. a curve that estimates the fraction of folded protein (Xf) as a function of concentration of the denaturant.
Denaturation midpoint is defined as “the denaturant concentration (CM) at which both the folded and unfolded states are equally populated at equilibrium” (i.e. 50% of the protein is folded and 50% is unfolded) (Munoz and Sanchez-Ruiz, 2004). This gives an initial quick estimate of protein stability, since a more stable protein generally requires higher concentrations of denaturant in order to reach the mid-point concentration of unfolding. Note that this is not a strict rule, since different proteins have different dependency between denaturant concentration and stability.
A thermodynamic analysis can be applied to the denaturation curve to determine the Gibbs free energy of unfolding (ΔGunfolding). The ΔGunfolding is a direct measure of protein stability and will allow you to determine quantitatively whether your mutant protein is as stable as the wild type. This analysis is based on a known linear relationship between the concentration of denaturant and the ΔGunfolding.
References
Bennion BJ and Daggett V. 2003. The molecular basis for the chemical denaturation of proteins by urea. Proc. Natl. Acad. Sci.100(9):5142-5147
Muiño PL and Callis PR. 2009. Solvent effects on the fluorescence quenching of tryptophan by amides via electron transfer. Experimental and computational studies. J. Phys. Chem. B. 113(9):2572-7
Munoz V and Sanchez-Ruiz JM. 2004. Exploring protein-folding ensembles: A variable-barrier model for the analysis of equilibrium unfolding experiments. Proc. Natl. Acad. Sci. 101:17646-17651
