
M6Q6: Calorimetry continued: Phase Changes and Heating Curves
Introduction
We witness and utilize changes of physical state, or phase transitions, in a great number of ways. As one example of global significance, consider the evaporation, condensation, freezing, and melting of water. These changes of state are essential aspects of our earth’s water cycle as well as many other natural phenomena and technological processes of central importance to our lives. In this section, phase transitions and heating curves are explored from a thermodynamics perspective. This section includes worked examples, sample problems, and a glossary.
Learning Objectives for Calorimetry: Phase Changes and Heating Curves
- Identify the relationship between heat, mass, temperature change, and heat capacities as applied to phase changes and heating curves.
| Heating Curves | Phase Changes | Quantifying Heat Flow During a Phase Change |
| Key Concepts and Summary | Key Equations | Glossary | End of Section Exercises |
Heating Curves
Recall the relationship between the amount of heat absorbed or released by a substance, q, and its accompanying temperature change, ΔT, already introduced in this module:
q = m × c × ΔT
where m is the mass of the substance and c is its specific heat. The relation applies to matter being heated or cooled, but not undergoing a change in state. When a substance being heated or cooled reaches a temperature corresponding to one of its phase transitions, further gain or loss of heat is a result of diminishing or enhancing intermolecular attractions, instead of increasing or decreasing molecular kinetic energies. While a substance is undergoing a change in state, its temperature remains constant.
Figure 1 shows a typical heating curve. Notice that heat (q) is on the x-axis since it is the independent variable. As heat is added, the temperature of the substance changes. Temperature is the dependent variable, and it’s placed on the y-axis. Notice that the slope of the line is positive as heat is added to ice at -10 °C. Once the ice is heated to 0 °C (the melting point of water), the line is flat (slope = 0) since no temperature change occurs as the phase change occurs. Once all the ice is melted, adding more heat will increase the temperature of the liquid water until the boiling point is reached. Then the liquid water boils and no temperature change occurs until all the liquid water is converted to steam (gaseous water). The heat required to melt water is significantly less than the amount of heat required to boil water. The graph illustrates this difference in the length of the segments representing melting and boiling.
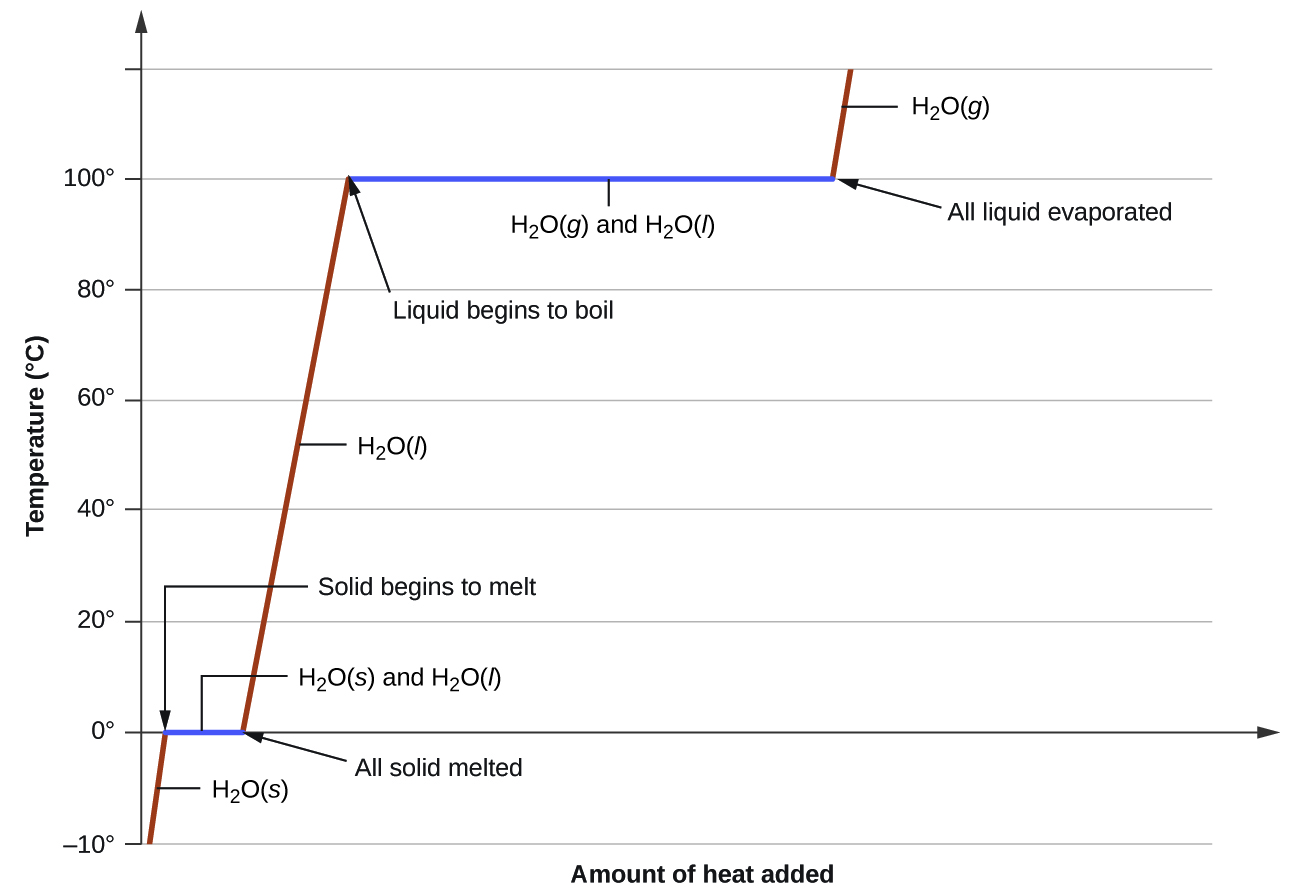
Consider the example of heating a pot of water to boiling. A stove burner will supply heat at roughly a constant rate; initially, this heat serves to increase the water’s temperature. When the water reaches its boiling point, the temperature remains constant despite the continued input of heat from the stove burner. This same temperature is maintained by the water as long as it is boiling. If the burner setting is increased to provide heat at a greater rate, the water temperature does not rise, but instead the boiling becomes more vigorous (rapid). This behavior is observed for other phase transitions as well: temperature remains constant while the change of state is in progress.
Phase Changes
Melting and Freezing
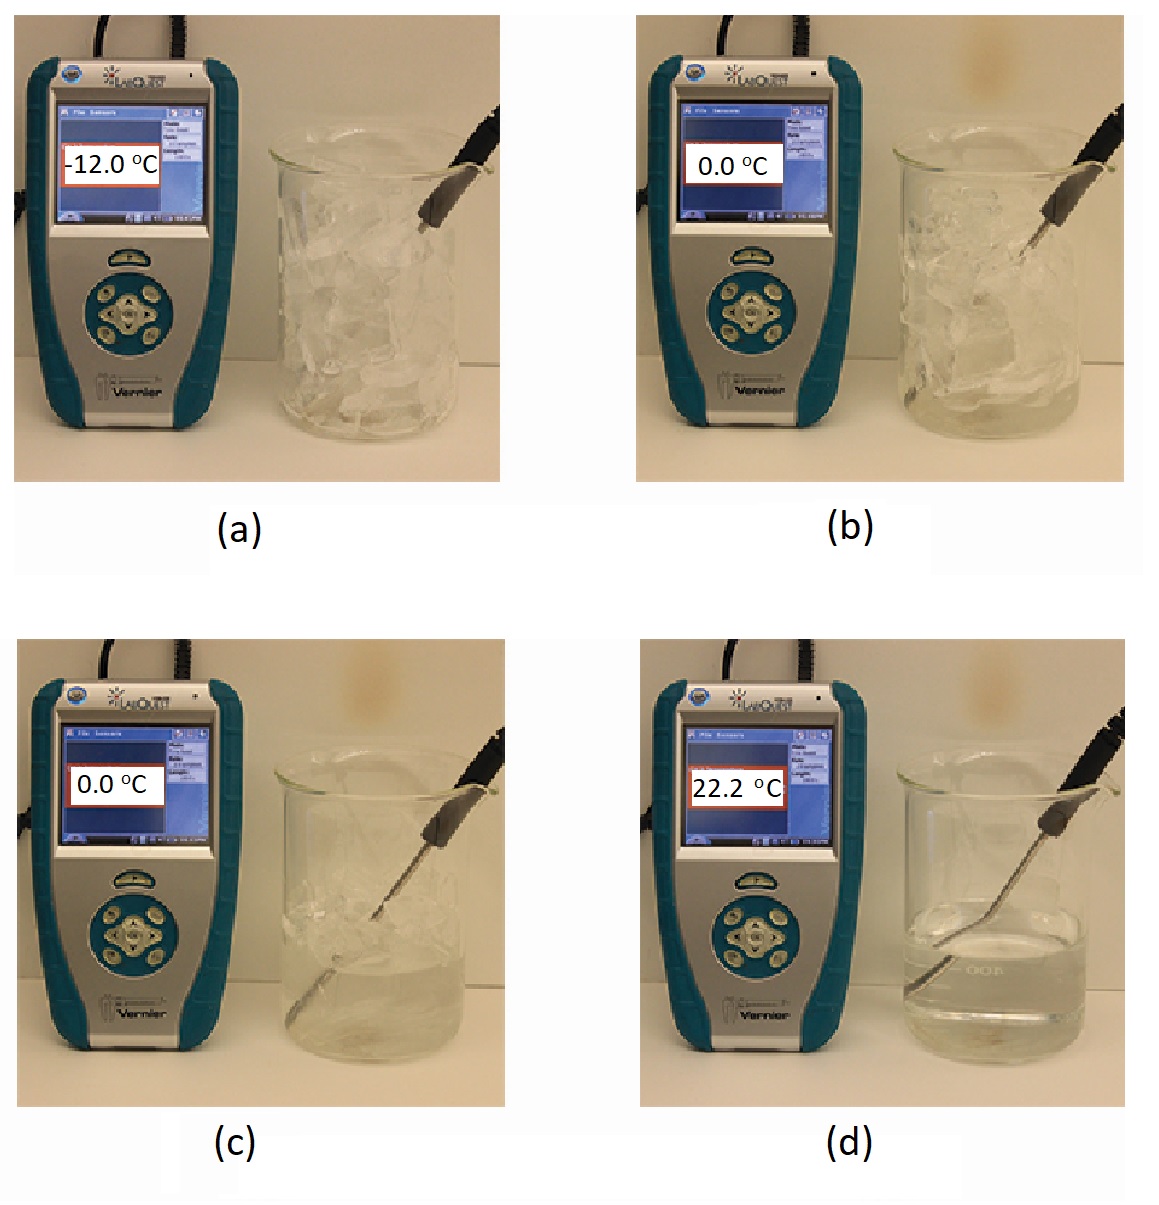
When we heat a crystalline solid, we increase the average energy of its atoms, molecules, or ions and the solid gets hotter. At some point, the added energy becomes large enough to partially overcome the forces holding the molecules or ions of the solid in their fixed positions, and the solid begins the process of transitioning to the liquid state, or melting. At this point, the temperature of the solid stops rising, despite the continual input of heat, and it remains constant until all of the solid is melted. Only after all of the solid has melted will continued heating increase the temperature of the liquid (Figure 2).
If we stop heating during melting and place the mixture of solid and liquid in a perfectly insulated container so no heat can enter or escape, the solid and liquid phases remain in equilibrium. This is almost the situation with a mixture of ice and water in a very good thermos bottle; almost no heat gets in or out, and the mixture of solid ice and liquid water remains for hours. In a mixture of solid and liquid at equilibrium, the reciprocal processes of melting and freezing occur at equal rates, and the quantities of solid and liquid therefore remain constant. This is called dynamic equilibrium. The temperature at which the solid and liquid phases of a given substance are in equilibrium is called the melting point of the solid or the freezing point of the liquid. Use of one term or the other is normally dictated by the direction of the phase transition being considered, for example, solid to liquid (melting) or liquid to solid (freezing).
The energy change associated with the melting or freezing processes is the enthalpy of fusion, ΔHfus. This is the energy required to melt 1 mole of substance. For example, the melting of water is endothermic and at standard temperature is represented by:
H2O(s) ⟶ H2O(ℓ) ΔHfus = 6.0 kJ/mol
The freezing of water is the reverse process and is exothermic, and therefore opposite in sign:
H2O(ℓ) ⟶ H2O(s) ΔHfreeze = -ΔHfus = -6.0 kJ/mol
Vaporization and Condensation
Vaporization is an endothermic process by which a liquid undergoes a phase change to a gas. Since vaporization is an endothermic process, this means that the system absorbs heat and the surroundings release heat, causing a cooling effect. The cooling effect can be felt when you leave a swimming pool or a shower. When the water on your skin evaporates, it absorbs heat from your skin and causes you to feel cold.
The energy change associated with the vaporization process is the enthalpy of vaporization, ΔHvap. This is the energy required to vaporize 1 mole of substance. For example, the vaporization of water at 25 °C is represented by:
H2O(ℓ) ⟶ H2O(g) ΔHvap = 44.01 kJ/mol (at 25 °C)
Evaporating 1 mole of liquid water at a higher temperature requires less energy than its evaporation at 25 °C. The enthalpy of vaporization for 1 mole water at its boiling point of 100 °C, is 40.67 kJ/mol.
H2O(ℓ) ⟶ H2O(g) ΔHvap = 40.67 kJ/mol (at 100 °C)
As described in this module, the reverse of an endothermic process is exothermic. The reverse of vaporization of condensation, a process in which a gas becomes a liquid. Thus, the condensation of a gas releases heat:
H2O(g) ⟶ H2O(ℓ) ΔHcond = -ΔHvap = -44.01 kJ/mol
It’s crucial to note that for water, the enthalpy of vaporization (liquid to gas phase change, 44.01 kJ/mol) is over seven times greater than the enthalpy of fusion (solid to liquid phase change, 6.0 kJ/mol). Why is this the case? We shall learn about hydrogen bonds in later modules on intermolecular forces. For the phase change from solid to liquid, the hydrogen bonds are only partially disrupted. However, for the phase change from liquid to gas, the hydrogen bonds must be completely broken as the water vapor molecules ideally do not interact at all. Completely breaking these bonds during vaporization requires much more energy than partially breaking them during melting.
Sublimation and Deposition
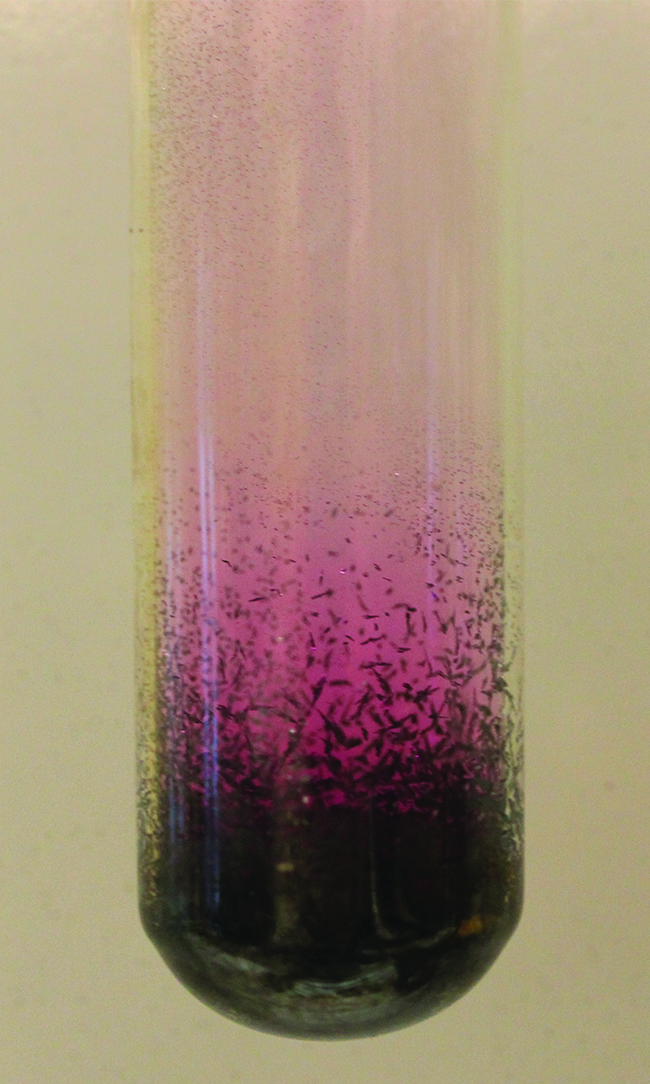
Some solids can transition directly into the gaseous state, bypassing the liquid state, via a process known as sublimation. At room temperature and standard pressure, a piece of dry ice (solid CO2) sublimes, appearing to gradually disappear without ever forming any liquid. Snow and ice sublime at temperatures below the melting point of water, a slow process that may be accelerated by winds and the reduced atmospheric pressures at high altitudes. When solid iodine is warmed, the solid sublimes and a vivid purple vapor forms (Figure 3). The reverse of sublimation is called deposition, a process in which gaseous substances condense directly into the solid state, bypassing the liquid state. The formation of frost is an example of deposition.
Like vaporization, the process of sublimation requires an input of energy to overcome intermolecular attractions. The enthalpy of sublimation, ΔHsub, is the energy required to convert one mole of a substance from the solid to the gaseous state. For example, the sublimation of carbon dioxide is endothermic and is represented by:
CO2(s) ⟶ CO2(g) ΔHsub = 26.1 kJ/mol (at 195 K)
Likewise, the enthalpy change for the reverse process of deposition is equal in magnitude but opposite in sign to that for sublimation:
CO2(g) ⟶ CO2(s) ΔHdep = -ΔHsub = -26.1 kJ/mol
Quantifying Heat Flow During a Phase Change
We were able to quantify the heat flow when a temperature change occurs using the relationship, q = m c ΔT. This equation is not useful for determining the heat flow during a phase change, however, because there is no temperature change (as shown in Figure 1 above). Using this equation when ΔT = 0 °C would yield q = 0, which we know is not true. Therefore, in order to calculate the amount of heat required for a phase transition, we need to use the enthalpy of the phase change. For example, one can calculate the amount of heat required to melt a given amount of a substance by taking into account the enthalpy of fusion of the substance and the amount of that substance (m, mass or n, moles, depending on the units of ΔHfus):
q = m ΔHfus or q = n ΔHfus melting
Melting is endothermic, so the heat flow should have a positive sign. The reverse process, freezing, is exothermic, and it should have a negative sign. The relationship similarly depends on the enthalpy of fusion of the substance and the amount of that substance (m, mass or n, moles). This time, however, a negative sign is incorporated:
q = m (-ΔHfus) or q = n (-ΔHfus) freezing
Quantifying the heat flow during vaporization and condensation would follow the same logic. We can summarize this using the following equation:
q = m × ΔHphase change
In this equation, q is the heat flow and ΔHphase change represents the enthalpy for the phase change, with the appropriate sign to indicate whether heat is flowing into or out of the system. In this equation, we have m representing the amount of substance undergoing the phase change. It is important to watch your units here — sometimes ΔH values are given in units of kJ/mol, sometimes in units of kJ/g, or even in J/g. The units will depend on what makes sense for the situation. Whether you use a mass for m or moles for n depends on what the units of ΔH are. Make sure that your units cancel appropriately using dimensional analysis, as always. The units of ΔH will also provide you with the unit of q (typically either J or kJ).
Example 1
Total Heat Needed to Change Temperature and Phase for a Substance
How much heat is required to convert 135 g of ice at −15 °C into water vapor at 120 °C?
Solution
The transition described involves the following steps:
- Heat ice from −15 °C to 0 °C
- Melt ice
- Heat water from 0 °C to 100 °C
- Boil water
- Heat steam from 100 °C to 120 °C
The heat needed to change the temperature of a given substance (with no change in phase) is: q = m × c × ΔT. The heat needed to induce a given change in phase is given by q = m × ΔHphase change. There is no temperature change during a phase change.
Using these equations with the appropriate values for specific heat of ice, water, and steam, and enthalpies of fusion (at 0 °C) and vaporization (at 100 °C), we have:
qtotal = qstep 1 + qstep 2 + qstep 3 + qstep 4 + qstep 5
qstep 1 = (m × c × ΔT)ice = (135 g) × (2.09 J/g·°C) × (0 °C – (-15 °C)) = 4230 J
qstep 2 = n × ΔHfusion = (135 g ×  ) × (6.01 kJ/mol) = 45.0 kJ
qstep 3 = (m × c × ΔT)water = (135 g) × (4.18 J/g·°C) × (100 °C – 0 °C) = 56,500 J
qstep 4 = n × ΔHvapor = (135 g × ) × (40.67 kJ/mol) = 305 kJ
qstep 5 = (m × c × ΔT)steam = (135 g) × (1.84 J/g·°C) × (120 °C – 100 °C) = 4970 J
Hint: Be careful with energy units! (convert joules to kilojoules)
qtotal = 4.23 kJ + 45.0 kJ + 56.5 kJ + 305 kJ + 4.97 kJ = 416 kJ
Check Your Learning
What is the total amount of heat released when 94.0 g water at 80.0 °C cools to form ice at -30.0 °C?
Answer:
68.7 kJ
This value is positive since the question asked about the amount of heat released. The calculation should lead to q = -68.7 kJ.
Key Concepts and Summary
Phase transitions are processes that convert matter from one physical state into another with no change in temperature. There are six phase transitions between the three phases of matter. Melting, vaporization, and sublimation are all endothermic processes, requiring an input of heat to overcome intermolecular attractions. The reciprocal transitions of freezing, condensation, and deposition are all exothermic processes, releasing heat as intermolecular attractive forces are established or strengthened.
When determining the heat flow for a phase change, you need to know the ΔH for the phase transition and the quantity of the substance that is undergoing the transition. When determining the heat flow for a temperature change, you need to know the quantity of substance, its specific heat capacity and the temperature change.
A heating curve depicts the amount of energy added or subtracted on the x-axis and the temperature of the substance on the y-axis. When determining the q for a heating curve, the phase transition line segments must be calculated separately from the temperature change segments since there are different processes for calculating the q values.
Key Equations
- q = m × ΔHphase change (make sure the units cancel appropriately!)
Glossary
- boiling point
- temperature at which the vapor pressure of a liquid equals the pressure of the gas above it
- condensation
- change from a gaseous to a liquid state
- deposition
- change from a gaseous state directly to a solid state
- dynamic equilibrium
- state of a system in which reciprocal processes are occurring at equal rates
- freezing
- change from a liquid state to a solid state
- freezing point
- temperature at which the solid and liquid phases of a substance are in equilibrium; see also melting point
- melting
- change from a solid state to a liquid state
- melting point
- temperature at which the solid and liquid phases of a substance are in equilibrium; see also freezing point
- sublimation
- change from solid state directly to gaseous state
- vaporization
- change from liquid state to gaseous state
Chemistry End of Section Exercises
- Heat is added to boiling water. Explain why the temperature of the boiling water does not change. What does change?
- Heat is added to ice at 0 °C. Explain why the temperature of the ice does not change. What does change?
- The enthalpy of vaporization of water is larger than its enthalpy of fusion. Explain why.
- A sample of isopropyl alcohol (C3H8O) is at 95 °C, and it is cooled until it reaches –25°C. Consider the q-terms given below, and identify all that must be summed together to determine the total heat exchanged during these processes. (The melting point of isopropyl alcohol is -89 °C, and the boiling point is 82.5 °C.)
qcool solid qwarm solid qmelt solid
qcool liquid qfreeze liquid qwarm liquid qevaporate liquid
qcool gas qcondense gas qwarm gas - How much heat is required to convert 422 g of liquid H2O at 23.5 °C into steam at 150 °C?
- Titanium tetrachloride, TiCl4, has a melting point of −23.2 °C and has a ΔH fusion = 9.37 kJ/mol.
- How much energy is required to melt 263.1 g TiCl4?
- For TiCl4, which will likely have the larger magnitude: ΔH fusion or ΔH vaporization? Explain your reasoning.
- Chlorofluorocarbons such as CF2Cl2 were once used as refrigerants. The standard enthalpy of evaporation of CF2Cl2 is 17.4 kJ/mol. How many moles of liquid CF2Cl2 must be evaporated to cool 150.0 g of water from 37.4 to 25.5 °C? The specific heat capacity of water is 4.184 J/g·°C.
- The heating curve for 100.0 grams of compound X is shown below.
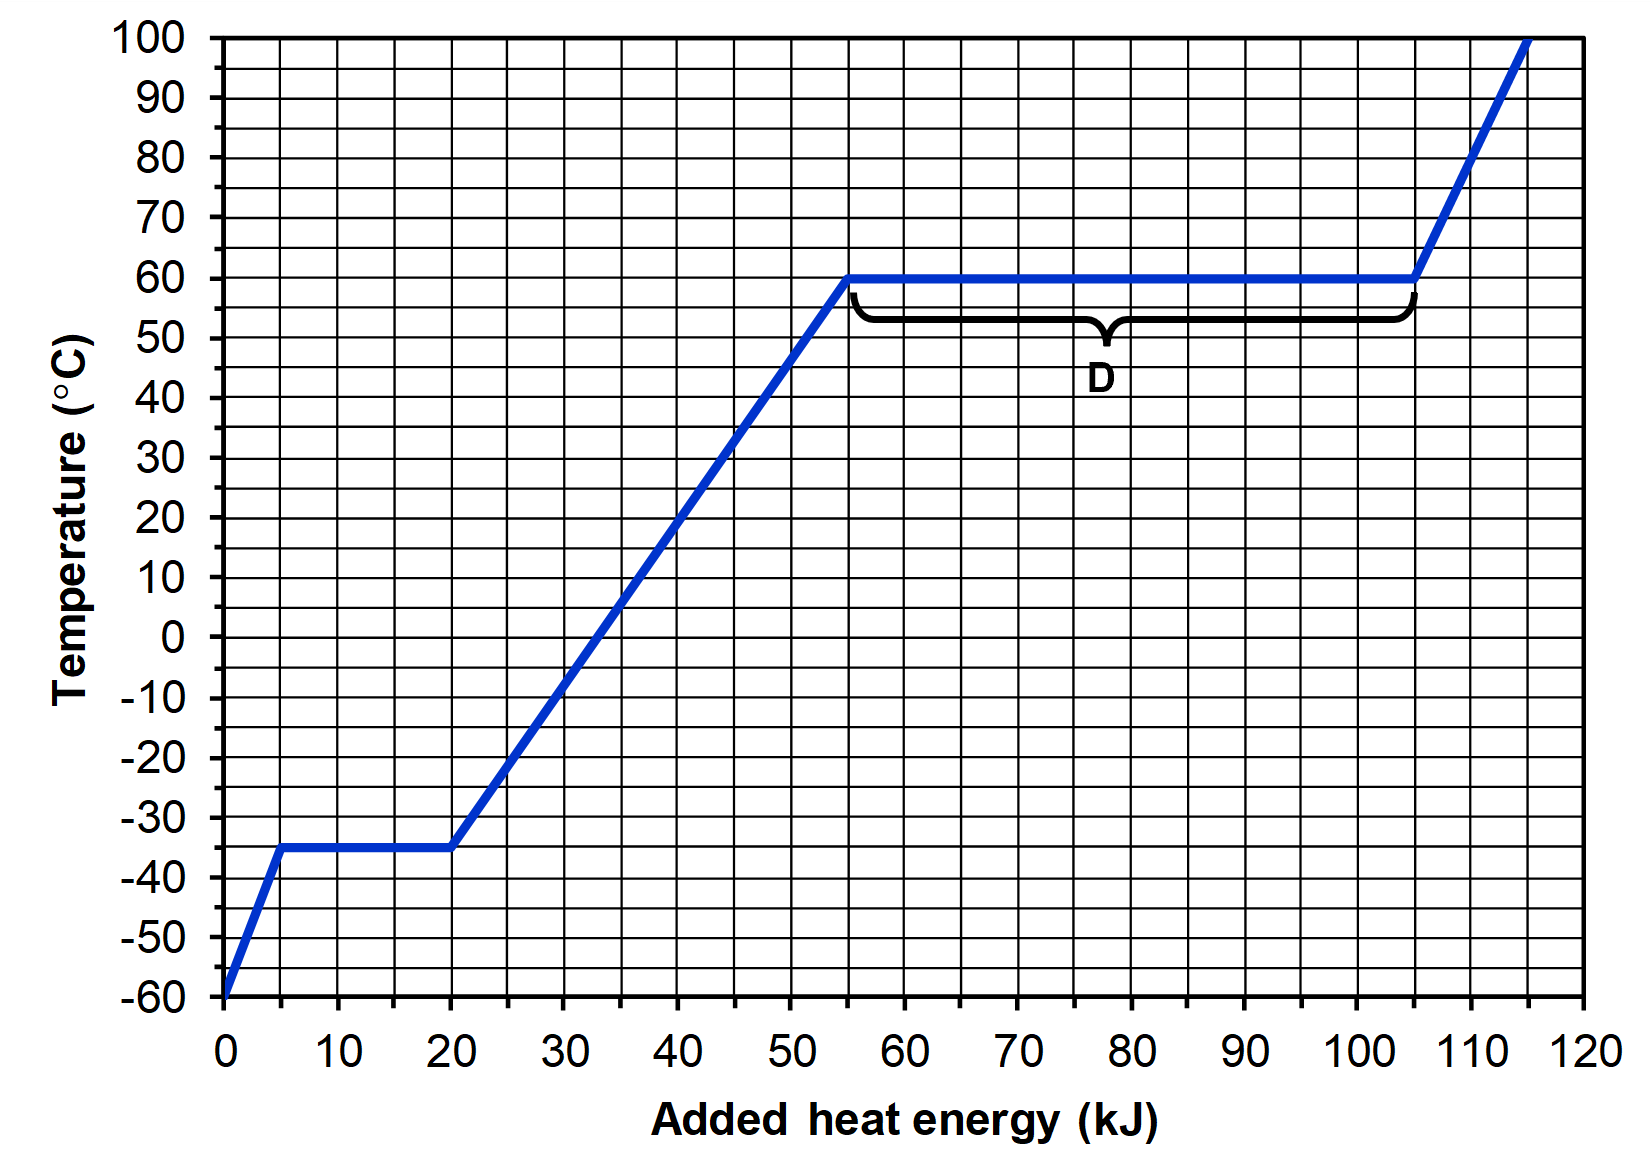
- What is the melting point of compound X?
- A 100.0 g sample of compound X is at –20.0°C. If 25 kJ of heat energy is transferred to the sample, what will its temperature be?
- What is the specific heat capacity of liquid X?
- In the segment of the curve labeled D:
- Explain why there is no change in temperature as heat is added to compound X.
- Explain, at the particle level, where the heat is going.
Answers to Chemistry End of Section Exercises
- The heat is absorbed by the water, providing the energy required to partially overcome intermolecular attractive forces in the liquid and causing a phase transition to gaseous water. The solution remains at 100 °C until all the water is boiled. Only the amount of water existing as liquid water changes until the liquid disappears. Then the temperature of the water can rise.
- The heat is absorbed by the ice, providing the energy required to partially overcome intermolecular attractive forces in the solid and causing a phase transition to liquid water. The solution remains at 0 °C until all the ice is melted. Only the amount of water existing as ice changes until the ice disappears. Then the temperature of the water can rise.
- For the phase change from solid to liquid, the hydrogen bonds are only partially disrupted. However, for the phase change from liquid to gas, the hydrogen bonds must be completely overcome as the water vapor molecules ideally do not interact at all. Completely overcoming these hydrogen bonds during vaporization requires much more energy than during melting.
- qcool gas, qcondense gas, and qcool liquid
- 1.13 × 10³ kJ
- (a) 13.0 kJ
(b) It is likely that the heat of vaporization will have a larger magnitude since in the case of vaporization the intermolecular interactions have to be completely overcome, while melting weakens or destroys only some of them. - 0.429 mol
- (a) -35 °C
(b) 47 °C
(c) 3.7 J/g·°C
(d) (i) The added heat is not converted to kinetic energy, so there is no change in temperature. (ii) The added heat energy is used to break intermolecular forces of attraction between X molecules.
Please use this form to report any inconsistencies, errors, or other things you would like to change about this page. We appreciate your comments. 🙂
