
M14Q4: Reaction Quotient
Learning Objectives
- Calculate the reaction quotient, Q, and compare it to the equilibrium constant, K, to predict the direction of a reaction.
- Determine the value of an equilibrium constant from equilibrium concentrations.
| Key Concepts and Summary | Key Equations | Glossary | End of Section Exercises |
A general equation for a reversible reaction may be written as follows:
aA + bB ⇌ cC + dD
We can write the reaction quotient (Q) for this equation. When evaluated using concentrations, it is called Qc. We use brackets to indicate molar concentrations of reactants and products.
Qc = ![\dfrac{[\text{C}]^{c}[\text{D}]^{d}}{[\text{A}]^{a}[\text{B}]^{b}}](https://wisc.pb.unizin.org/app/uploads/quicklatex/quicklatex.com-c99010cd61d59cb096d746f0767947a4_l3.png "Rendered by QuickLaTeX.com")
The reaction quotient is equal to the molar concentrations of the products of the chemical equation (multiplied together) over the reactants (also multiplied together), with each concentration raised to the power of the coefficient of that substance in the balanced chemical equation. For example, the reaction quotient for the reversible reaction 2 NO2(g) ⇌ N2O4(g) is given by this expression:
Qc = ![\dfrac{[\text{N}_{2}\text{O}_{4}]}{[\text{NO}_{2}]^{2}}](https://wisc.pb.unizin.org/app/uploads/quicklatex/quicklatex.com-6c8780853330b2d03f032c95eeaf8b63_l3.png "Rendered by QuickLaTeX.com")
Notice that the Qc expression is the same as the Kc expression; however, they will only have the same numerical value when the system is at at equilibrium. Kc represents the system only when it is at equilibrium. Qc represents the system at any point during the reaction. The numerical value of Qc for a given reaction varies; it depends on the concentrations of products and reactants present at the time when Qc is determined. When pure reactants are mixed, Qc is initially zero because there are no products present at that point. As the reaction proceeds, the value of Qc increases as the concentrations of the products increase and the concentrations of the reactants simultaneously decrease (Figure 1a and 1c). Conversely, when only products are present, Qc is initially very large. As the reaction proceeds, the value of Qc decreases as the concentration of the products decrease and the concentration of the reactants simultaneously increase (Figure 1b and 1d). When the reaction reaches equilibrium, the value of the reaction quotient is equal to the equilibrium constant and no longer changes because the concentrations no longer change (Figure 1c and 1d). The reaction quotient by itself does not give us particularly useful information, but when compared to the equilibrium constant, it gives us useful information about the reaction progress.
![Four graphs are shown and labeled, “a,” “b,” “c,” and “d.” The y-axis on graph a is labeled, “Concentration,” and the x-axis is labeled, “Time.” Three curves are plotted on graph a. The first is labeled, “[ S O subscript 2 ];” this line starts high on the y-axis, ends midway down the y-axis, has a steep initial slope and a more gradual slope as it approaches the far right on the x-axis. The second curve on this graph is labeled, “[ O subscript 2 ];” this line mimics the first except that it starts and ends about fifty percent lower on the y-axis. The third curve is the inverse of the first in shape and is labeled, “[ S O subscript 3 ].” The y-axis on graph b is labeled, “Concentration,” and the x-axis is labeled, “Time.” Three curves are plotted on graph b. The first is labeled, “[ S O subscript 2 ];” this line starts low on the y-axis, ends midway up the y-axis, has a steep initial slope and a more gradual slope as it approaches the far right on the x-axis. The second curve on this graph is labeled, “[ O subscript 2 ];” this line mimics the first except that it ends about fifty percent lower on the y-axis. The third curve is the inverse of the first in shape and is labeled, “[ S O subscript 3 ].” The y-axis on graph c is labeled, “Reaction Quotient,” and the x-axis is labeled, “Time.” A single curve is plotted on graph c. This curve begins at the bottom of the y-axis and rises steeply up near the middle of the y-axis, then levels off into a horizontal dotted line labeled, “equilibrium constant.” The y-axis on graph d is labeled, “Reaction Quotient,” and the x-axis is labeled, “Time.” A single curve is plotted on graph d. This curve begins at the top of the y-axis and falls steeply down near the middle of the y-axis, then levels off into a horizontal dotted line labeled, “equilibrium constant.”](https://wisc.pb.unizin.org/app/uploads/sites/557/2020/10/Qc_SO3.png)
Example 1
Evaluating a Reaction Quotient
Gaseous nitrogen dioxide forms dinitrogen tetroxide according to this equation:
2 NO2(g) ⇌ N2O4(g)
When 0.10 mol NO2 is added to a 1.0-L flask at 25 °C, the concentration changes so that at equilibrium, [NO2] = 0.016 M and [N2O4] = 0.042 M.
- What is the value of the reaction quotient before any reaction occurs?
- What is the value of the equilibrium constant for the reaction?
Solution
- Before any product is formed, [NO2] =
 = 0.10 M, and [N2O4] = 0 M. Thus, Qc =
 ![\dfrac{[\text{N}_{2}\text{O}_{4}]}{[\text{NO}_{2}]^{2}} = \dfrac{0}{0.10^{2}}](https://wisc.pb.unizin.org/app/uploads/quicklatex/quicklatex.com-75505728e353bad3eb2cebd5b263e0fd_l3.png "Rendered by QuickLaTeX.com") = 0
= 0 - At equilibrium, the value of the equilibrium constant is equal to the value of the reaction quotient. At equilibrium, Kc = Qc =
![\dfrac{[\text{N}_{2}\text{O}_{4}]}{[\text{NO}_{2}]^{2}} = \dfrac{0.042}{0.016^{2}}](https://wisc.pb.unizin.org/app/uploads/quicklatex/quicklatex.com-668e373bc15bd072094f8a5dad26af6a_l3.png "Rendered by QuickLaTeX.com") = 1.6 × 10². The equilibrium constant is 1.6 × 10².
= 1.6 × 10². The equilibrium constant is 1.6 × 10².
Check Your Learning
For the reaction 2 SO2(g) + O2(g) ⇌ 2 SO3(g), the concentrations at equilibrium are [SO2] = 0.90 M, [O2] = 0.35 M, and [SO3] = 1.1 M. What is the value of the equilibrium constant, Kc?
Answer:
Kc = 4.3
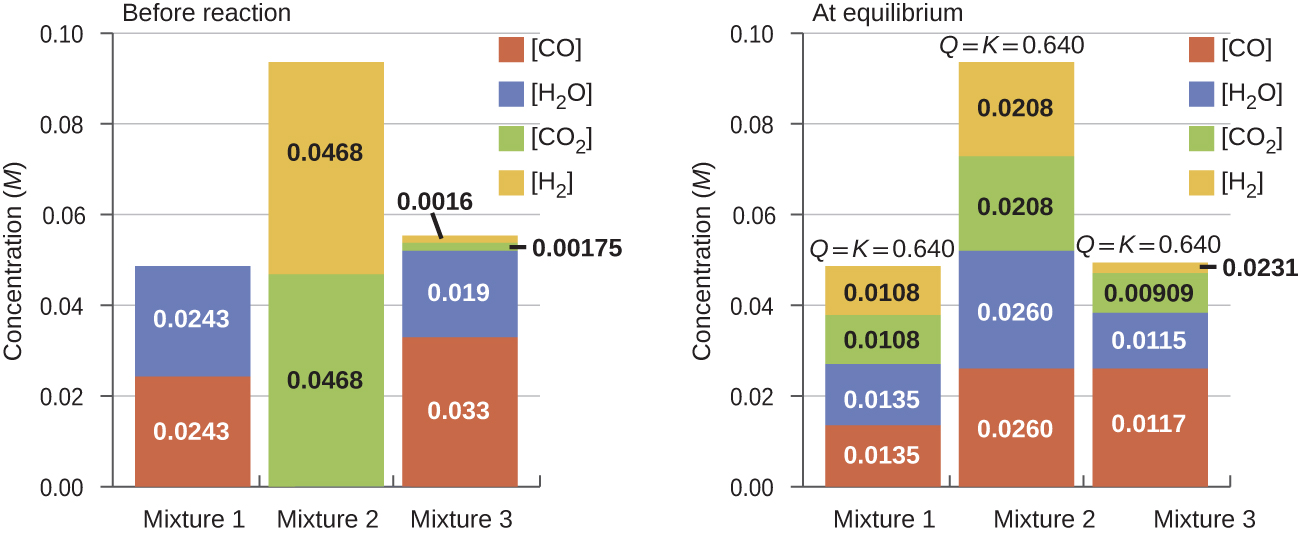
Once a value of Kc is known for a reaction, it can be used to predict directional shifts when compared to the value of Qc. A system that is not at equilibrium will proceed in the direction that establishes equilibrium. The data in Figure 2 illustrate this. When heated to a consistent temperature, 800 °C, three different starting mixtures of CO, H2O, CO2, and H2 (left figure) react to reach compositions adhering to the same equilibrium constant (right figure, the value of Qc changes until it equals the value of Kc). This value is 0.640, the equilibrium constant for the reaction under these conditions.
CO(g) + H2O(g) ⇌ CO2(g) + H2(g) Kc = 0.640 T = 800 °C
It is important to recognize that an equilibrium can be established starting either from reactants or from products, or from a mixture of both. For example, equilibrium was established from Mixture 2 in Figure 2 when the products of the reaction were heated in a closed container. In fact, one technique used to determine whether a reaction is truly at equilibrium is to approach equilibrium starting with reactants in one experiment and starting with products in another. If the same value of the reaction quotient is observed when the concentrations stop changing in both experiments, then we may be certain that the system has reached equilibrium.
Example 2
Predicting the Direction of Reaction
Here are the starting concentrations of reactants and products for three experiments involving this reaction:
CO(g) + H2O(g) ⇌ CO2(g) + H2(g) Kc = 0.64
Determine in which direction the reaction proceeds as it goes to equilibrium in each of the three experiments shown.
| Reactants/Products | Experiment 1 | Experiment 2 | Experiment 3 |
| [CO]i | 0.0203 M | 0.011 M | 0.0094 M |
| [H2O]i | 0.0203 M | 0.0011 M | 0.0025 M |
| [CO2]i | 0.0040 M | 0.037 M | 0.0015 M |
| [H2]i | 0.0040 M | 0.046 M | 0.0076 M |
Solution
Experiment 1:
Qc = ![\dfrac{[\text{CO}_{2}][\text{H}_{2}]}{[\text{CO}][\text{H}_{2}\text{O}]} = \dfrac{(0.0040)(0.0040)}{(0.0203)(0.02030)}](https://wisc.pb.unizin.org/app/uploads/quicklatex/quicklatex.com-1d4619530ae06ea1f9ebe6d271532be1_l3.png "Rendered by QuickLaTeX.com") = 0.039
= 0.039
Qc < Kc (0.039 < 0.64), the reaction will shift to the right.
Experiment 2:
Qc = ![\dfrac{[\text{CO}_{2}][\text{H}_{2}]}{[\text{CO}][\text{H}_{2}\text{O}]} = \dfrac{(0.037)(0.046)}{(0.011)(0.0011)}](https://wisc.pb.unizin.org/app/uploads/quicklatex/quicklatex.com-73226d9da7f05113eaaec9c2161d8f01_l3.png "Rendered by QuickLaTeX.com") = 1.4 × 102
= 1.4 × 10²
Qc > Kc (140 > 0.64), the reaction will shift to the left.
Experiment 3:
Qc = ![\dfrac{[\text{CO}_{2}][\text{H}_{2}]}{[\text{CO}][\text{H}_{2}\text{O}]} = \dfrac{(0.0015)(0.0076)}{(0.0094)(0.0025)}](https://wisc.pb.unizin.org/app/uploads/quicklatex/quicklatex.com-17a6a5735036d628c3ccd91a7313adb5_l3.png "Rendered by QuickLaTeX.com") = 0.48
= 0.48
Qc < Kc (0.48 < 0.64), the reaction will shift to the right.
Check Your Learning
Calculate the reaction quotient and determine the direction in which each of the following reactions will proceed to reach equilibrium.
- A 1.00-L flask containing 0.0500 mol of NO(g), 0.0155 mol of Cl2(g), and 0.500 mol of NOCl:
2 NO(g) + Cl2(g) ⇌ 2 NOCl(g) Kc = 4.6 x 10⁴
- A 5.0-L flask containing 17 g of NH3, 14 g of N2, and 12 g of H2:
N2(g) + 3 H2(g) ⇌ 2 NH3(g) Kc = 0.060
- A 2.00-L flask containing 230 g of SO3(g):
2 SO3(g) ⇌ 2 SO2(g) + O2(g) Kc = 0.230
Answer:
(a) Qc = 6.45 × 10³, shifts right.
(b) Qc = 0.24, shifts left.
(c) Qc = 0, shifts right.
Key Concepts and Summary
In earlier sections, we looked at how to evaluate systems at equilibrium, but we also need a way to study systems not at equilibrium. We can use the same ratio between the amount of products and reactants, using amounts that may or may not be at equilibrium, but defining this ratio as the reaction quotient, Q. If we find that Q = K, then the system is at equilibrium. If Q > K, the system has too many products and will proceed in the reverse direction to achieve equilibrium. If Q < K, the system has too many reactants and will proceed in the forward direction to achieve equilibrium.
Key Equations
- aA + bB ⇌ cC + dD
- Q =
![\dfrac{[\text{C}]^{c}[\text{D}]^{d}}{[\text{A}]^{a}[\text{B}]^{b}}](https://wisc.pb.unizin.org/app/uploads/quicklatex/quicklatex.com-c8431dd0ecf1b3362a38122facd3f12e_l3.png "Rendered by QuickLaTeX.com")
Glossary
- reaction quotient (Q)
- also equal to the ratio of amounts of products over the reactants, much like the equilibrium constant. The amounts of products and reactants can be at any point during the reaction.
Chemistry End of Section Exercises
- The initial concentrations or pressures of reactants and products are given for each of the following systems. Calculate the reaction quotient and determine the direction in which each system will proceed to reach equilibrium.
- 2 NH3(g) ⇌ N2(g) + 3 H2(g) Kc = 17;
[NH3] = 0.20 M, [N2] = 1.00 M, [H2] = 1.00 M - 2 SO3(g) ⇌ SO2(g) + O2(g) Kc = 0.230;
[SO3] = 1.00 M, [SO2] = 0.00 M, [O2] = 0.00 M - 2 SO3(g) ⇌ 2 SO2(g) + O2(g) Kc = 0.230;
[SO3] = 1.00 M, [SO2] = 1.00 M, [O2] = 1.00 M - 2 SO3(g) ⇌ SO2(g) + O2(g) Kc = 0.230;
[SO3] = 0.75 M, [SO2] = 0.20 M, [O2] = 0.050 M - N2(g) + O2(g) ⇌ 2 NO(g) KP = 0.050
Initial pressures of NO = 10.0 atm and O2 = N2 = 5.0 atm
- 2 NH3(g) ⇌ N2(g) + 3 H2(g) Kc = 17;
- Determine if the following system is at equilibrium. If not, in which direction will the system need to shift to reach equilibrium?
SO2Cl2(g) ⇌ SO2(g) + Cl2(g) Kc = 0.078
[SO2Cl2] = 0.12 M, [Cl2] = 0.16 M, [SO2] = 0.050 M
- At 700 K, the reaction: 2 SO2(g) + O2(g) ⇌ 2 SO3(g) has the equilibrium constant Kc = 4.3 × 10⁶. If the concentrations in the flask are [SO2] = 0.10 M, [SO3] = 10. M, and [O2] = 0.10 M, which of the following statements is true?
- Q > Kc, and the reaction will proceed from left to right to achieve equilibrium
- Q > Kc, and the reaction will proceed from right to left to achieve equilibrium
- Q < Kc, and the reaction will proceed from left to right to achieve equilibrium
- Q < Kc, and the reaction will proceed from right to left to achieve equilibrium
- Q = Kc, and the reaction is currently at equilibrium
- The equilibrium between NO2 and N2O4 can be described by the following equation:
2 NO2(g) ⇌ N2O4(g) Kp = 7.0
If a sealed flask contains 1.5 atm of NO2 and 14.2 atm of N2O4, which of the following is the true statement?
- The system is not at equilibrium. Qp < Kp. Total pressure will increase as equilibrium is achieved.
- The system is not at equilibrium: Qp < Kp. Total pressure will decrease as equilibrium is achieved.
- The system is not at equilibrium: Qp < Kp. Total pressure will remain the same as equilibrium is achieved.
- The system is not at equilibrium. Qp > Kp. Total pressure will increase as equilibrium is achieved.
- The system is not at equilibrium: Qp > Kp. Total pressure will decrease as equilibrium is achieved.
- The dissolving of lead(II) chloride can be described by the following equilibrium:
PbCl2(s) ⇌ Pb2+(aq) + 2 Cl–(aq) K = 1.7 × 10⁻⁵
If a solution contains [Pb2+] = 0.10 M and [Cl–] = 0.010 M in contact with PbCl2(s), what will happen as the solution and the PbCl2(s) are stirred?
- Some PbCl2 will dissolve as Q < K.
- PbCl2 will precipitate as Q < K.
- Some PbCl2 will dissolve as Q > K.
- PbCl2 will precipitate as Q > K.
- Q cannot be calculated because [PbCl2(s)] is unknown, so it is not possible to predict any observations.
Answers to Chemistry End of Section Exercises
- (a) Qc = 25, Qc > Kc so equilibrium will shift toward reactants
(b) Qc = 0, Qc < Kc so equilibrium will shift toward products (another way to consider this is that since there are only reactants present in the beginning, the reaction can only move toward products)
(c) Qc = 1, Qc > Kc so equilibrium will shift toward the reactants
(d) Qc = 0.0178, Qc < Kc so equilibrium will shift toward products
(e) QP = 4, Qp > Kp so equilibrium will shift toward the reactants - Qc = 0.067, Qc < Kc so equilibrium will shift toward products
- C
- B
- A
Please use this form to report any inconsistencies, errors, or other things you would like to change about this page. We appreciate your comments. 🙂
