
M16Q4: Titration of a Strong Acid with a Strong Base
Learning Objectives
- Describe the equipment and chemical reactions involved in acid-base titrations.
- Determine pH and concentrations of chemical species at any point in the titration of a strong acid by a strong base or a strong base by a strong acid.
- Select an appropriate indicator for a given acid-base titration.
| Acid-Base Indicators |
| Key Concepts and Summary | Glossary | End of Section Exercises |
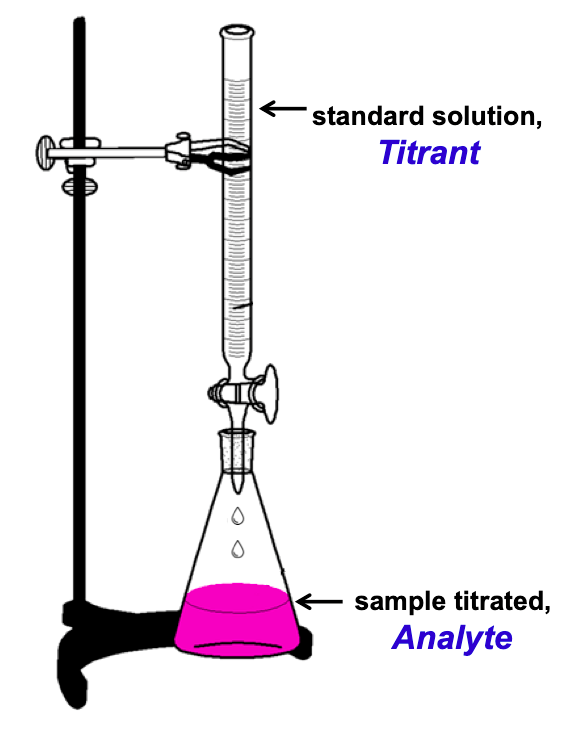
A typical titration analysis involves the use of a buret (Figure 1) to make incremental additions of a solution containing a known concentration of some substance (the titrant) to a sample solution containing the substance whose concentration is to be measured (the analyte). The titrant and analyte undergo a chemical reaction of known stoichiometry, and so the volume of titrant solution required for complete reaction with the analyte (the equivalence point of the titration) can be used to determine the analyte concentration. Though any type of chemical reaction may serve as the basis for a titration analysis, the most common involve precipitation, acid-base, or redox reactions..
Titration Curve
Previously, when we studied acid-base reactions in solution, we focused only on the point at which the acid and base were stoichiometrically equal. No consideration was given to the pH of the solution before, during, or after the neutralization. Example 1 looks at several stages of an acid-base reaction, including after neutralization.
Example 1
Calculating pH for Titration Solutions: Strong Acid/Strong Base
A titration is carried out for 25.00 mL of 0.100 M HCl (strong acid) with 0.100 M of a strong base NaOH the titration curve is shown in Figure 2. Calculate the pH at these volumes of added base solution:
- 0.00 mL
- 12.50 mL
- 25.00 mL
- 37.50 mL
Solution
Since HCl is a strong acid, we can assume that all of it dissociates. The initial concentration of H3O+ is 0.100 M. When the base solution is added, it also dissociates completely, providing OH− ions. The H3O+ and OH− ions neutralize each other, so only those of the two that were in excess remain, and their concentration determines the pH. Thus, the solution is initially acidic (pH < 7), but eventually all the hydronium ions present from the original acid are neutralized, and the solution becomes neutral. As more base is added, the solution turns basic.
First, we write out our reaction, reacting the strong base with HCl:
OH–(aq) + H3O+(aq) → 2 H2O(ℓ)
Second, we create an SCF (Start→Change→Finish) table, finding the moles of acid to begin with:
25.00 mL ×  = 0.00250 moles H3O+
| OH–(aq) + H3O+(aq) → 2 H2O(ℓ) | |||
| S (Start) | 0.00250 | – | |
| C (Change) | |||
| F (Finish) | |||
Now we are set up to approach the problem!
(a) added base = 0 mL
Since we have not added any base to the solution yet, we can first just calculate the pH of the initial HCl solution.
pH = -log[H3O+] = -log(0.100 M) = 1.000
(b) added base = 12.50 mL
Once we start to add base, we will calculate the moles of base added and put that value in our SCF table.
12.50 mL ×  = 0.00125 moles OH–
| OH–(aq) + H3O+(aq) → 2 H2O(ℓ) | |||
| S (Start) | 0.00125 | 0.00250 | – |
| C (Change) | |||
| F (Finish) | |||
Then, we subtract whichever number of moles is smaller between the two reactants, ensuring that at least one reactant’s quantity goes to zero and other reactant’s remaining quantity is positive.
| OH–(aq) + H3O+(aq) → 2 H2O(ℓ) | |||
| S (Start) | 0.00125 | 0.00250 | – |
| C (Change) | -0.00125 | -0.00125 | – |
| F (Finish) | 0 | 0.00125 | – |
Lastly, we ask ourselves “What’s in my beaker?”. In this case, we have excess strong acid and need to calculate the new concentration of the hydronium ion in order to calculate the resulting pH.
 = 0.0333 M H3O+
pH = -log[H3O+] = 1.477
(c) added base = 25.00 mL
First, we will calculate the moles of base added and put that value in our SCF table.
25.00 mL × = 0.00250 moles OH–
| OH–(aq) + H3O+(aq) → 2 H2O(ℓ) | |||
| S (Start) | 0.00250 | 0.00250 | – |
| C (Change) | |||
| F (Finish) | |||
Then, we subtract whichever number of moles is smaller between the two reactants, ensuring that at least one reactant’s quantity goes to zero and other reactant’s remaining quantity is positive (or zero).
| OH–(aq) + H3O+(aq) → 2 H2O(ℓ) | |||
| S (Start) | 0.00250 | 0.00250 | – |
| C (Change) | -0.00250 | -0.00250 | – |
| F (Finish) | 0 | 0 | – |
Lastly, we ask ourselves “What’s in my beaker?”. In this case, all of our strong base and strong acid have reacted and all we have left is water. The pH of pure water is 7.00.
(d) added base = 37.50 mL
First, we will calculate the moles of base added and put that value in our SCF table.
37.50 mL × = 0.00375 moles OH–
| OH–(aq) + H3O+(aq) → 2 H2O(ℓ) | |||
| S (Start) | 0.00375 | 0.00250 | – |
| C (Change) | |||
| F (Finish) | |||
Then, we subtract whichever number of moles is smaller between the two reactants, ensuring that at least one reactant’s quantity goes to zero and other reactant’s remaining quantity is positive.
| OH–(aq) + H3O+(aq) → 2 H2O(ℓ) | |||
| S (Start) | 0.00375 | 0.00250 | – |
| C (Change) | -0.00250 | -0.00250 | – |
| F (Finish) | 0.00125 | 0 | – |
Lastly, we ask ourselves “What’s in my beaker?”. In this case, we have excess strong base and need to calculate the new concentration of the hydroxide ion in order to calculate the resulting pH.
 = 0.0200 M OH–
pOH = -log[OH–] = 1.698
pH = 14.00 – pOH = 14.00 – 1.698 = 12.301
Check Your Learning
Calculate the pH for the strong acid/strong base titration between 50.0 mL of 0.100 M HNO3(aq) and 0.200 M NaOH (titrant) at the listed volumes of added base: 0.00 mL, 15.0 mL, 25.0 mL, and 40.0 mL.
Answer:
Vol 0.00 mL: pH = 1.000
Vol 15.0 mL: pH = 1.5111
Vol 25.0 mL: pH = 7.000
Vol 40.0 mL: pH = 12.523
In the example, we calculated pH at four points during a titration. The most straightforward acid-base reactions are those of a strong acid with a strong base. Figure 2 shows data for the titration of a 25.0-mL sample of 0.100 M hydrochloric acid with 0.100 M sodium hydroxide, where the pH measured after successive additions of small amounts of NaOH are graphed in a form that is called a titration curve (graphing pH versus volume of titrant added). The pH increases slowly at first, increases rapidly in the middle portion of the curve, and then increases slowly again. The point of inflection (located at the midpoint of the vertical part of the curve) is the equivalence point for the titration. It indicates when equivalent quantities of acid and base are present. For the titration of a strong acid with a strong base, the equivalence point occurs at a pH of 7.00 since only water remains and [H3O+] = [OH–] = 1.0 × 10⁻⁷ M. (see Example 1, part C).

Acid-Base Indicators
The equivalence point of a titration may be detected visually if a distinct change in the appearance of the sample solution accompanies the completion of the reaction. More commonly, special dyes called indicators are added to the sample solutions to impart a change in color at or very near the equivalence point of the titration. Equivalence points may also be detected by measuring some solution property that changes in a predictable way during the course of the titration (like the pH). Regardless of the approach taken to detect a titration’s equivalence point, the volume of titrant actually measured is called the end point. Properly designed titration methods typically ensure that the difference between the equivalence and end points is negligible.
Certain organic substances, such as phenolphthalein, which can be used to determine the pH of a solution, are called acid-base indicators. Acid-base indicators are either weak organic acids or weak organic bases. For example, phenolphthalein is a colorless substance in any aqueous solution with a hydronium ion concentration greater than 5.0 × 10⁻⁹M (pH < 8.3). In more basic solutions where the hydronium ion concentration is less than 5.0 × 10⁻⁹M (pH > 8.3), it is red or pink.
Another acid-base indicator is methyl orange, which is a weak acid. The equilibrium can be represented by an equation in which we use HIn as a simple representation for the complex methyl orange molecule:
HIn(aq) + H2O(ℓ) ⇄ H3O+(aq) + In–(aq)
red yellow
Ka = ![\dfrac{[\text{H}_{3}\text{O}^{+}][\text{In}^{-}]}{[\text{HIn}]}](https://wisc.pb.unizin.org/app/uploads/quicklatex/quicklatex.com-34596a1ca0e7a997c5a944f73f98f161_l3.png "Rendered by QuickLaTeX.com") = 4.0 × 10-4
= 4.0 × 10⁻⁴
The nonionized form, HIn, is red, and the anion of methyl orange, In−, is yellow. When we add acid to a solution of methyl orange, the increased hydronium ion concentration shifts the equilibrium toward the nonionized red form, in accordance with Le Châtelier’s principle. If we add base, we shift the equilibrium towards the yellow form. This behavior is completely analogous to the action of buffers.
There are many different acid-base indicators that cover a wide range of pH values and can be used to determine the approximate pH of an unknown solution by a process of elimination. Universal indicators and pH paper contain a mixture of indicators and exhibit different colors at different pHs. Figure 3 presents several indicators, their colors, and their color-change intervals.
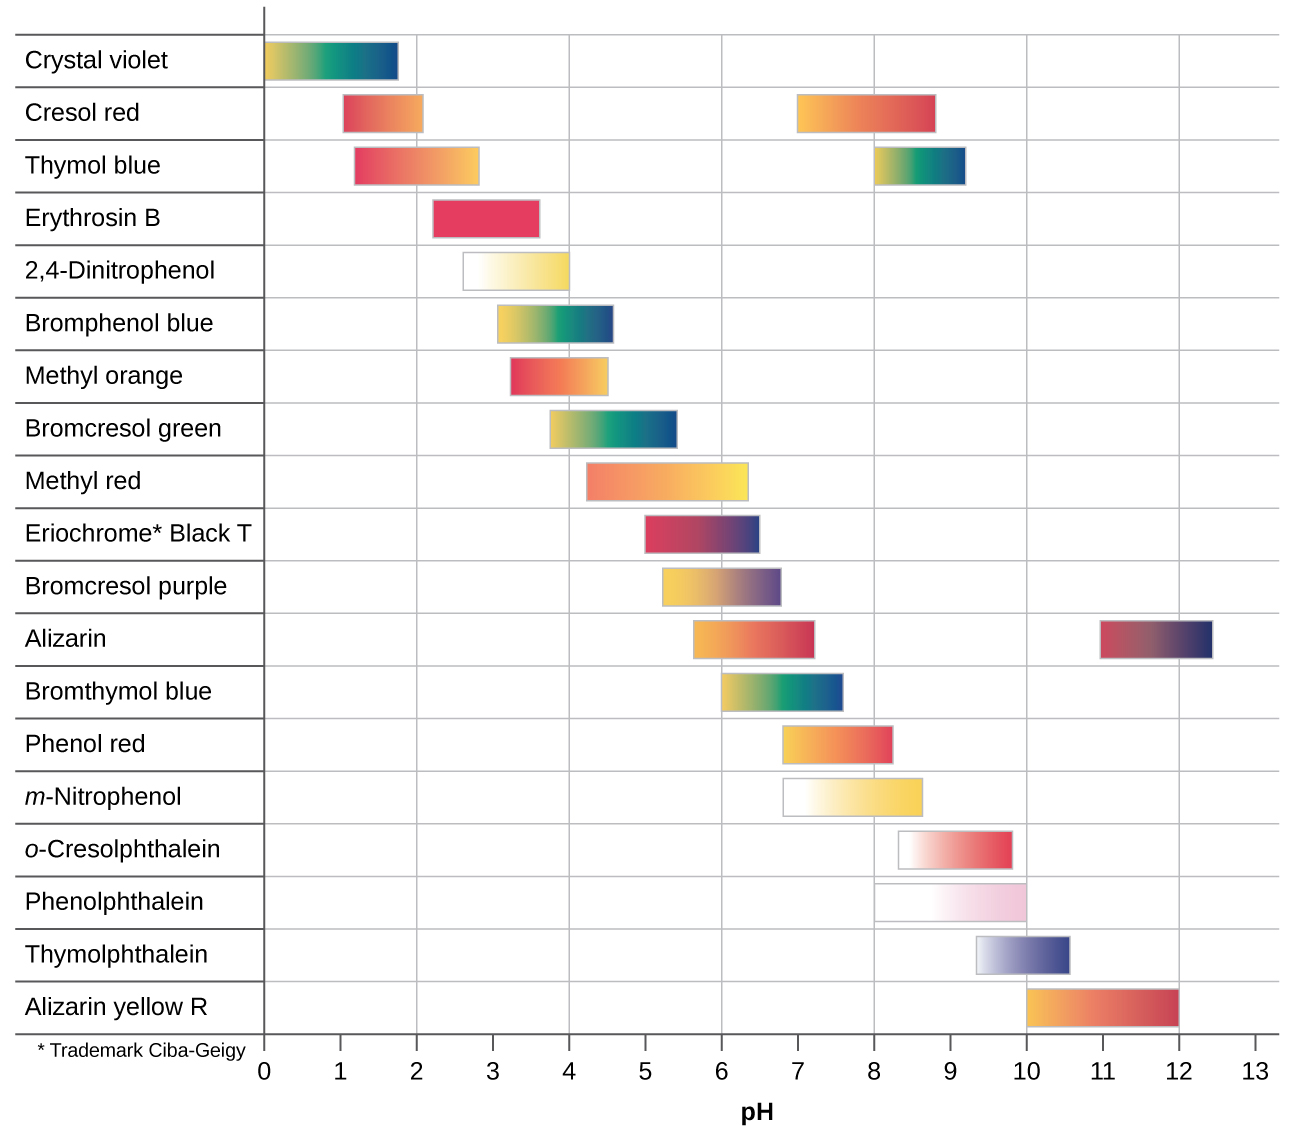
Titration curves help us pick an indicator that will provide a sharp color change at the equivalence point. The best selection would be an indicator that has a color change interval that brackets the pH at the equivalence point of the titration.
The color change intervals of three indicators are shown in Figure 4. The equivalence points of both the titration of the strong acid and of the weak acid are located in the color-change interval of phenolphthalein. We can use it for titrations of either strong acid with strong base or weak acid with strong base.
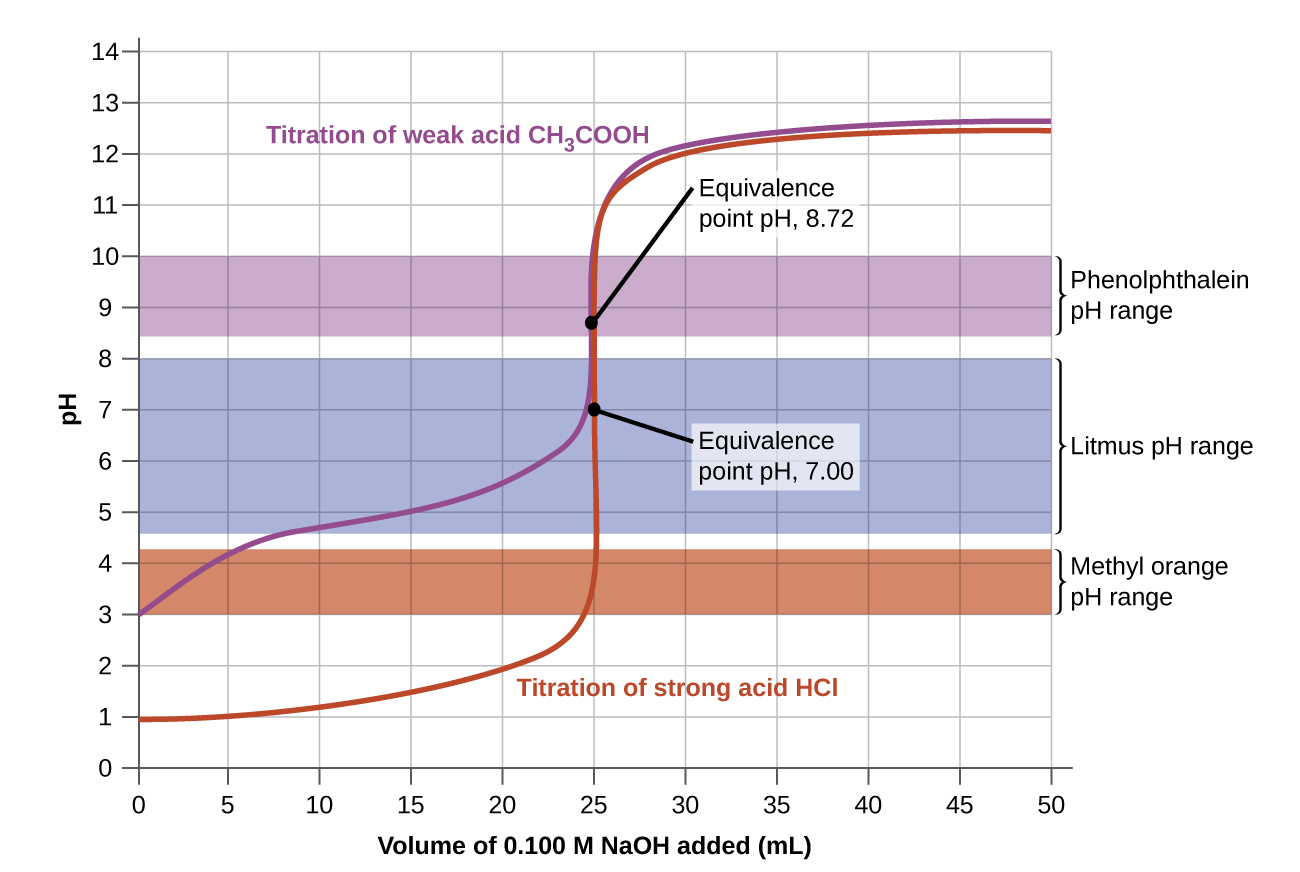
Litmus is a suitable indicator for the HCl titration because its color change brackets the equivalence point. However, we should not use litmus for the CH3COOH titration because the pH is within the color-change interval of litmus when only about 12 mL of NaOH has been added, and it does not leave the range until 25 mL has been added. The color change would be very gradual, taking place during the addition of 13 mL of NaOH, making litmus useless as an indicator of the equivalence point.
We could use methyl orange for the HCl titration, but it would not give very accurate results: (1) It completes its color change slightly before the equivalence point is reached (but very close to it, so this is not too serious); (2) it changes color, as Figure 4 shows, during the addition of nearly 0.5 mL of NaOH, which is not so sharp a color change as that of litmus or phenolphthalein; and (3) it goes from yellow to orange to red, making detection of a precise endpoint much more challenging than the colorless to pink change of phenolphthalein. Figure 4 shows us that methyl orange would be completely useless as an indicator for the CH3COOH titration. Its color change begins after about 1 mL of NaOH has been added and ends when about 8 mL has been added. The color change is completed long before the equivalence point (which occurs when 25.0 mL of NaOH has been added) is reached and hence provides no indication of the equivalence point.
Key Concepts and Summary
A titration analysis, typically an acid-base reaction, involves a solution of known concentration incrementally added to a solution of unknown concentration until the reaction is complete, also known as the equivalence point. If the pH is measured throughout the reaction, the pH can be plotted versus the volume of titrant added to create a titration curve. Indicators can be used that change color at a specific pH value, preferably near the equivalence point. The end point is the amount of titrant added when the color of the indicator changes.
Glossary
- acid-base indicator
- color indicators used in acid-base solutions that can be used to determine the pH of a solution
- analyte
- a substance whose concentration is to be measured
- buret
- a graduated glass tube used to add a solution in precise increments
- end point
- the volume of titrant added when the indicator changes color
- equivalence point
- the volume of titrant added when the moles of titrant added is equal to the moles of analyte during a titration
- indicator
- special dyes used during a titration that impart a change in color at or very near the equivalence point
- titrant
- a solution of known concentration
- titration analysis
- a chemical reaction that occurs by making incremental additions of a solution of known concentration to a substance whose concentration is to be measured
- titration curve
- a graph of pH versus volume of titrant added
Chemistry End of Section Exercises
- What is the difference between an equivalence point and the end point in a titration?
- In a general chemistry lab session, 50.0 mL 1.0 M HNO3 is titrated with 0.5 M KOH.
- Write the net ionic equation for the titration reaction that occurs when 50.0 mL of 1.0 M HNO3 is titrated with 0.50 M KOH.
- Are there spectator ions present? If so, what are they and how will they affect the pH?
- What will the pH be at the equivalence point?
- How many moles of KOH will be added to the analyte to reach the equivalence point?
- How many mL of KOH will be added to the analyte to reach the equivalence point?
- In a general chemistry lab session, 80.0 mL 0.800 M Ba(OH)2 is titrated with 0.500 M HBr.
- Write the net ionic equation for the titration reaction that occurs when 50.0 mL 0.800 MBa(OH)2 is titrated with 0.500 M HBr.
- Are there spectator ions present? If so, what are they and how will they affect the pH?
- What will the pH be at the equivalence point?
- How many moles of HBr will be added to the analyte to reach the equivalence point?
- How many mL of HBr will be added to the analyte to reach the equivalence point?
- 40.0 mL of 0.080 M NaOH is titrated with 0.020 M HCl. Calculate the pH at the following points:
- Initially, before any HCl has been added
- When 80.0 mL HCl has been added
- When 140.0 mL HCl has been added
- When 160.0 mL HCl has been added
- When 180.0 mL HCl has been added
- When 200.0 mL HCl has been added
- Sketch the titration curve that results from this titration
- 25.0 mL of a 0.125 M HI solution is titrated with a 0.075 M Ca(OH)2 solution. How many mL must be added to get to the equivalence point?
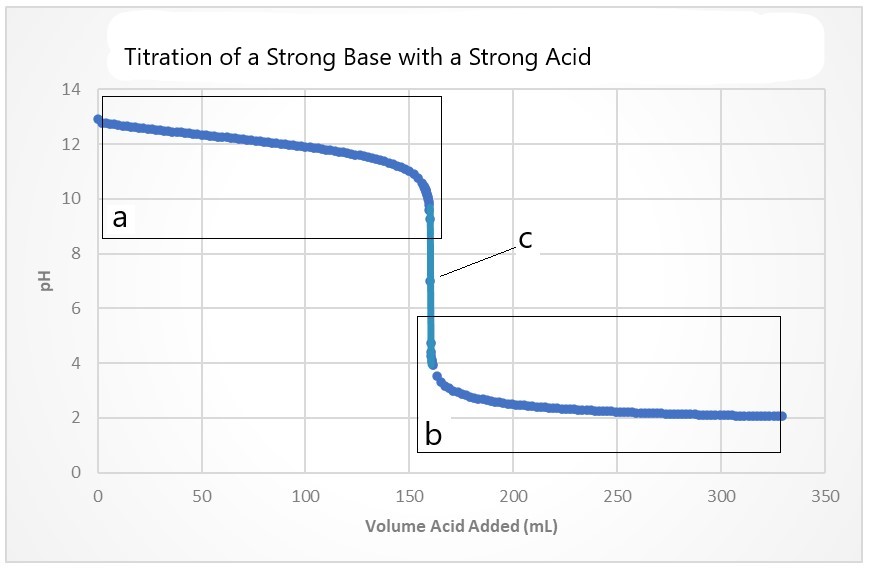
- In the titration curve below, discuss each region of the titration curve in terms of concentrations of strong acid, strong base and pH:
- For the titration of 50.0 mL 0.50 M KOH(aq) with 0.10 M HNO3(aq), what are the coordinates (volume of HNO3 added, pH) of the equivalence point?
- 25.00 mL of 1.00 M HCl reacts with the ammonia molecules in a sample of Cu(NH3)4SO4·2H2O. It is found by titration that 45.72 mL of 0.100 M NaOH is required to react with the excess HCl. How many moles of ammonia were in the original sample?
- Methyl red is an acid-base indicator with Ka = 6.3 × 10⁻⁶. The unionized form, HIn, is red, and the anionic form, In–, is yellow. What is the color of a solution of methyl red at pH = 7.8?
- Green
- Red
- Blue
- Yellow
- Orange
Answers to Chemistry End of Section Exercises
- The equivalence point occurs when stoichiometric amount of titrant has been added to the analyte, that is the analyte and titrant have completely reacted and there is no excess amount of either. The end point occurs at the point in a titration when an indicator has undergone a visible change, often a color change. In a colorimetric titration, the observable change is a change in color owing to the addition of a small amount of indicator to the analyte solution. The goal in a colormetric titration is that the equivalence point of the titration and the end point of the indicator will be as close together as possible to minimize error.
- (a) H3O+(aq) + OH–(aq) ⇌ 2 H2O(ℓ)
(b) Yes, spectator ions are present.; K+ and NO3–; These are neutral ions and will not affect the pH.
(c) 7.00; All of the acid and base have reacted, leaving only water and neutral spectator ions.
(d) 0.050 mol KOH
(e) 1.0 × 10² mL - (a) H3O+(aq) + OH–(aq) ⇌ 2 H2O(ℓ)
(b) Yes, spectator ions are present.; Ba2+ and Br–; These are neutral ions and will not affect the pH.
(c) 7.00
(d) 0.128 mol HBr
(e) 256 mL - (a) 12.90; (b) 12.12; (c) 11.35; (d) 7.00 (equivalence point); (e) 2.74; (f) 2.48
(g)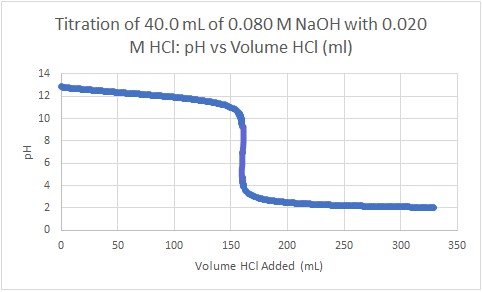
- 20.8 mL
- (a) There is an excess of strong base, no strong acid, and pH>7
(b) There is an excess of strong acid, no strong base, and a pH<7
(c) All of the strong acid has completely reacted with the strong base so there is no strong acid, no strong base, and pH = 7.00 - 250.0 mL HNO3 added, pH = 7.00
- 0.0204 mol NH3
- D
Please use this form to report any inconsistencies, errors, or other things you would like to change about this page. We appreciate your comments. 🙂
