
M11Q2: Heating Curves and Phase Diagrams
Introduction
In this section, we continue analyzing phase diagrams (plots of pressure vs. temperature) and correlate them to the heating curves (plots of temperature vs. energy) that you learned about earlier in the semester. We will also continue to use the phase diagram to understand the conditions needed for phase transitions. Finally, we will look at the heat of vaporization and the relationship between heat of vaporization and temperature and pressure.
Learning Objectives for Heating Curves and Phase Diagrams
- Correlate heating curves to phase diagrams.
| Heating Curves and Phase Diagrams | - Use phase diagrams to estimate conditions for phase transitions.
| Using Phase Diagrams | - Relate enthalpy of vaporization to boiling temperature and pressure.
| Clausius-Clapeyron Equation | Enthalpy of Vaporization |
| Key Concepts and Summary | Key Equations | Glossary | End of Section Exercises |
Heating Curves and Phase Diagrams
The previous chapter detailed phase diagrams of pressure vs. temperature. In an earlier module, you learned about heating curves. These two types of plots provide complementary information, as seen in Figure 1. A heating curve is constructed by measuring the temperature of a substance as heat is added at constant pressure. In Figure 1A the pressure at which these measurements of water are made is 1 atm. Recall that the horizontal line segments on this type of plot indicate a phase change, and so both solid and liquid or liquid and gas phases are present as the water melts or vaporizes (light blue and green horizontal lines, respectively), but the temperature of the water does not change until the phase transition is complete.
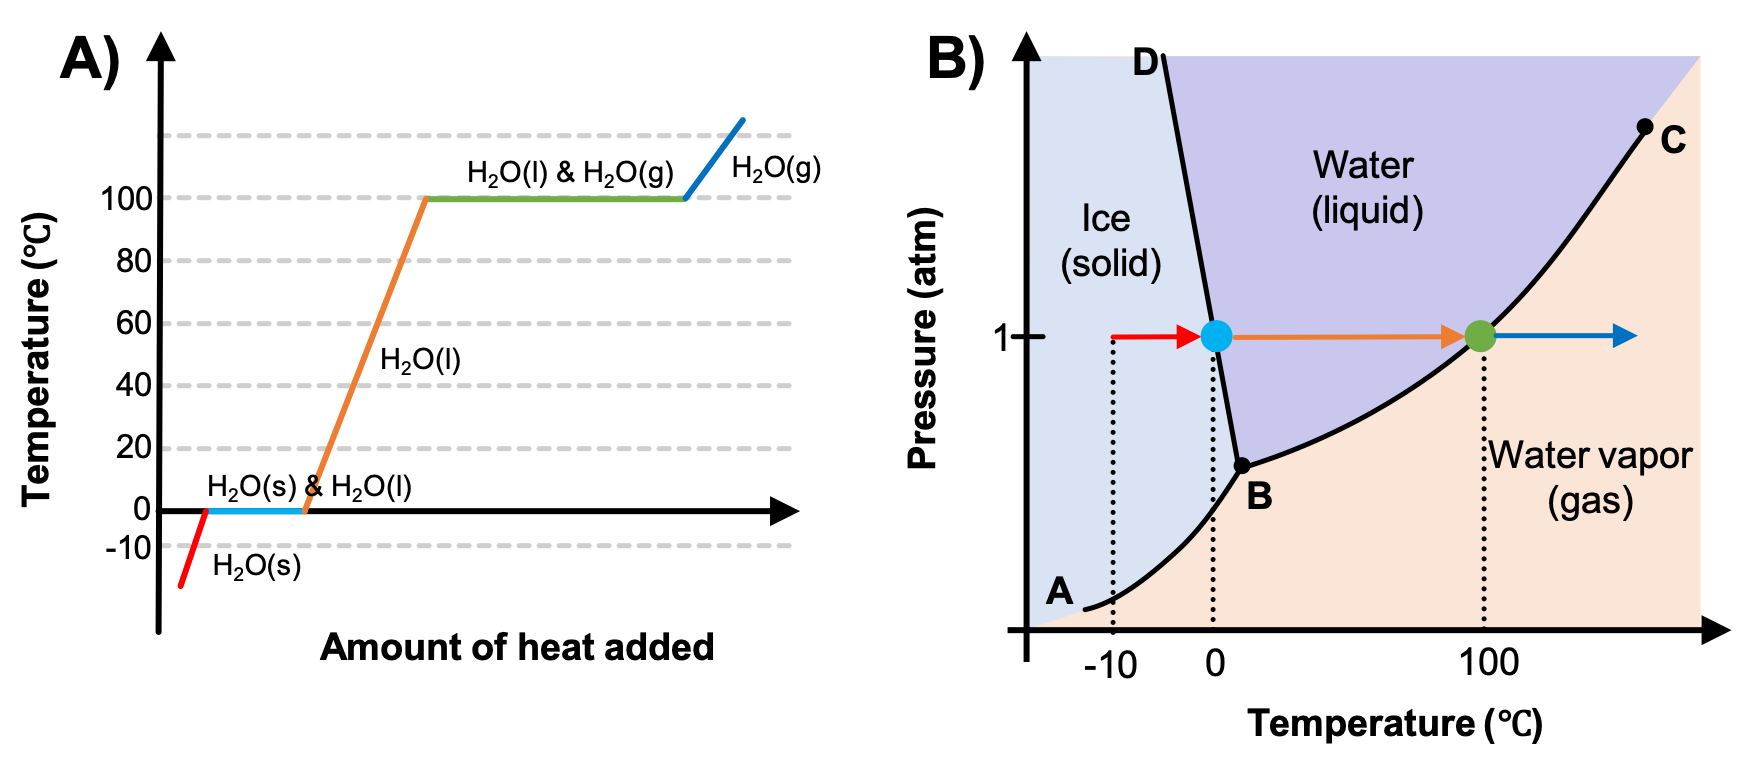
Now consider the phase diagram in Figure 1B that you saw in the previous section. The arrows trace a path of increasing temperature at a constant pressure, the same pressure as used in the heating curve. As heat is added to ice, the temperature begins to increase (red lines in both plots). Once the temperature reaches 0 °C, a phase change begins as the ice melts (represented by the blue dot on Figure 1B; the size of the dot is only chosen for clarity because the phase transition occurs only at the pressure and temperature of the phase boundary). Since Figure 1B is only indicating the temperature and not the amount of heat added, the temperature remains constant as the phase change occurs, so the dot is used to indicate that the temperature is not changing during the phase change. Only once all the ice has melted will the water, now in the liquid phase, begin to increase in temperature again (orange arrow) as the pressure remains constant. Once 100 °C is reached, another phase change will occur (green dot).
Example 1
Correlating heating curves and phase diagrams
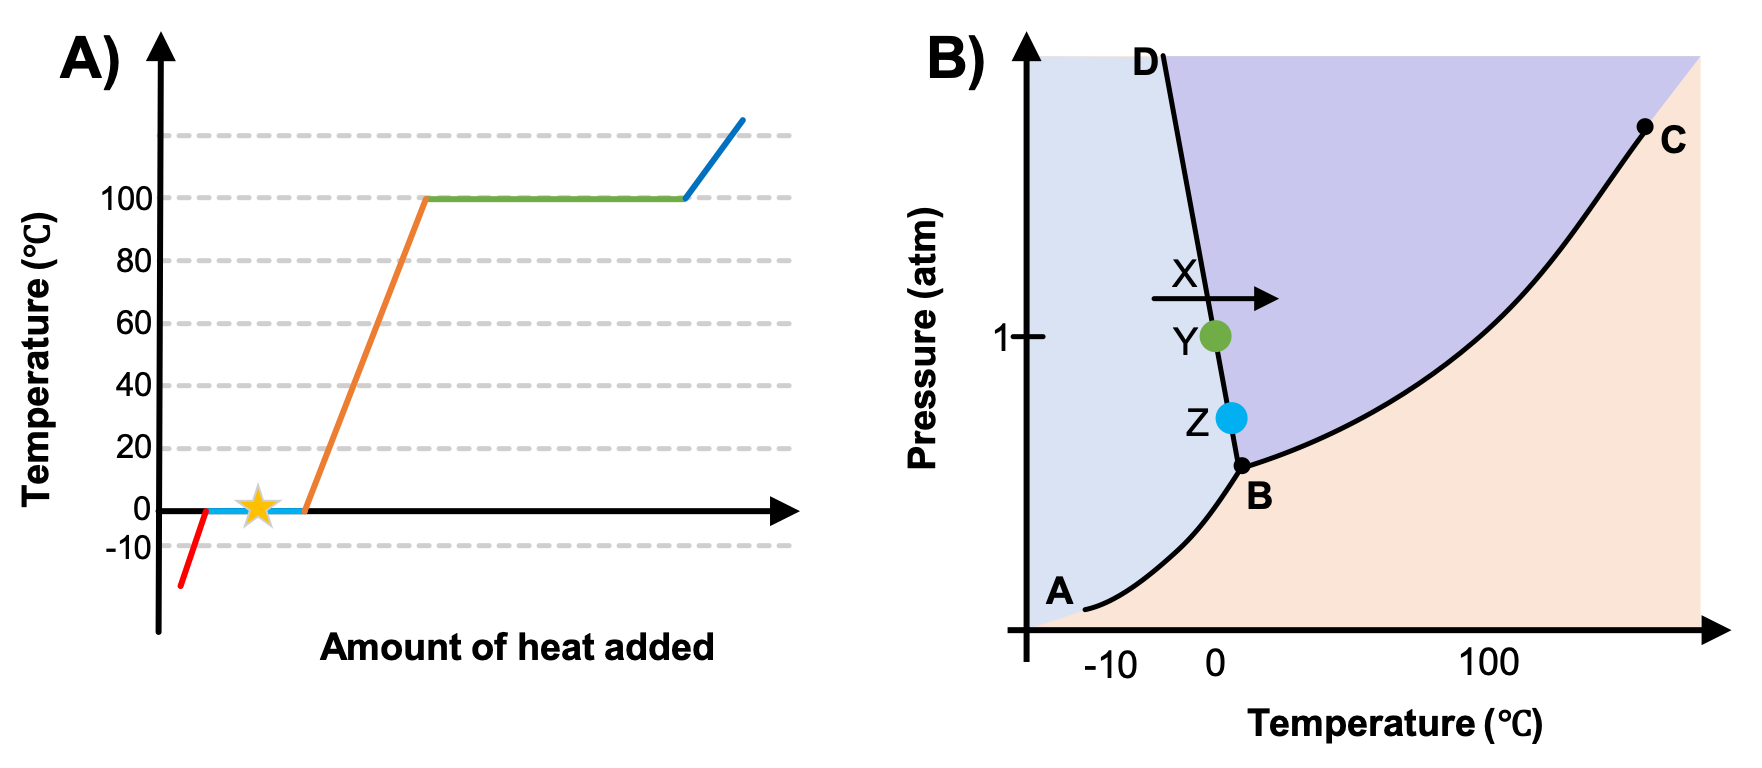
A heating curve was prepared with data taken at 1 atm (Figure 2A). Which point or section of the phase diagram in Figure 2B corresponds to the conditions represented by the star in Figure 2A?
- The line segment AB
- The line segment BD
- The arrow X
- The point Y
- The point Z
Solution
While anywhere along the line segment BD represents a phase change from solid to liquid, and points Y and Z are both on that line, the correct answer is D. At point Y, the phase change is occurring at the same pressure (1 atm) that was used to construct the heating curve. The arrow X represents both a temperature change and a phase change.
Using Phase Diagrams
As seen in the previous sections, phase diagrams contain a wealth of information about the physical states of a substance. For example, if given a temperature and pressure, you could use a phase diagram to determine the phase of that substance. If you were provided a pressure, you could use a phase diagram to determine at what temperature a phase transition will occur. You can even predict if or which phase transition will occur when heat is added to the substance.
Recall that we have previously used the term “normal” to refer to 1 atm of pressure (as in the “normal boiling point” of a substance). You can now use a phase diagram to determine the normal boiling point (or normal melting point) of any substance by determining the temperature at which the substance boils (or melts) at 1 atm. Keep in mind that some substances may not have a normal melting or boiling point because that phase transition never occurs at 1 atm.
Example 2
Using phase diagrams
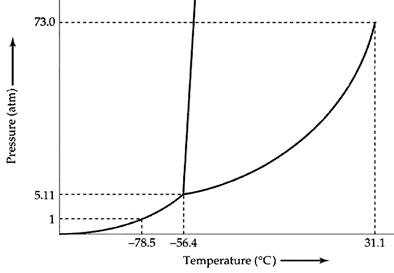
The phase diagram for CO2 is provided in Figure 3. A sample of CO2 is at 20 °C and 1 atm. Will a phase change occur if you slowly increase the pressure on CO2 but keep the temperature constant? If so, which phase change?

Solution
Yes, at 20 °C and 1 atm, CO2 exists as a gas in your original sample. If the temperature remains constant and we increase the pressure, we would trace a path upward on the graph. We would eventually reach the phase boundary between the gas and liquid phases and the gas would condense to a liquid.
Demonstration: Liquefying CO2 in a constant volume container
Set up. The phase diagram for CO2 presented in Figure 3 indicates that at -78.5°C and 1 atm of pressure, CO2 exists as a solid (which we call dry ice). As dry ice warms, it will sublime and form CO2(g). In this demonstration, dry ice is placed in a constant-volume container and allowed to warm. A pressure gauge is attached to the container to measure the pressure inside the container.
Prediction. As the dry ice sublimes, predict whether the pressure in the container will increase, decrease, or stay the same.
Explanation. Crushed dry ice begins to sublime as the container begins to warm. As it sublimes, the presence of CO2(g) causes the pressure inside the container to increase. The system is following the solid-gas coexistence curve of the phase diagram since both solid and gas are present in the container. Eventually, the pressure and temperature inside the container reach the triple point, where solid, liquid, and gas can coexist. You can see the liquid CO2 sitting on top of the solid CO2 in the video. At the end of the video, the container is vented, releasing the built up pressure and causing the solid and gas coexistence to be reestablished.
Demonstration: Ice bomb
Set up. The following video demonstrates how water expands as it freezes. A cast iron container is placed in an ice water bath and filled with ice water. A lid is tightened onto the container, making this a constant-volume container. The container is then placed in liquid nitrogen to cool it (the boiling point of liquid nitrogen is -196 °C [-320 °F]). A box is placed over the container to contain any shrapnel from the container.
Explanation. The liquid water is initially at 1 atm. As it is cooled by the liquid nitrogen, the pressure remains constant and the temperature decreases until the liquid-solid coexistence curve is reached at 1 atm and 0°C. At this point, the liquid inside the container begins to freeze. As we have seen before, as water freezes, it expands. As the water expands, the pressure increases. Since liquid and solid still coexist in the container, we remain along the liquid-solid coexistence curve as the temperature continues to decrease and the pressure increases. Eventually, the container can no longer contain the pressure and the “bomb” explodes.
Enthalpy of Vaporization
Vaporization is an endothermic process, as described earlier in the semester. As a review, the cooling effect can be evident when you leave a swimming pool or a shower. When the water on your skin evaporates, it removes heat from your skin and causes you to feel cold. The energy change associated with the vaporization process is the enthalpy of vaporization, ΔHvap. For example, the vaporization of water at standard temperature is represented by:
H2O(ℓ) → H2O(g) ΔHvap = 44.01 kJ/mol
As described in the module on Thermochemistry, the reverse of an endothermic process is exothermic. And so, the condensation of a gas releases thermal energy.
H2O(g) → H2O(ℓ) ΔHcon = -ΔHvap = -44.01 kJ/mol
Example 3
Using Enthalpy of Vaporization
One way our body is cooled is by evaporation of the water in sweat (Figure 4). In very hot climates, we can lose as much as 1.5 L of sweat per day. Although sweat is not pure water, we can get an approximate value of the amount of heat removed by evaporation by assuming that it is. How much heat is required to evaporate 1.5 L of water (1.5 kg) at T = 37 °C (normal body temperature); ΔHvap = 43.46 kJ/mol at 37 °C.

Solution
We start with the known volume of sweat (approximated as just water) and use the given information to convert to the amount of heat needed:
1.5 L ×  = 3.6 × 10³ kJ
Thus, 3600 kJ of heat are removed by the evaporation of 1.5 L of water.
Check Your Learning
How much heat is required to evaporate 100.0 g of liquid ammonia, NH3, at its boiling point if its enthalpy of vaporization is 4.8 kJ/mol?
Answer:
28 kJ
Clausius-Clapeyron Equation
In the previous module, you learned that there is a correlation between a substance’s vapor pressure and its IMFs: stronger IMFs lead to a lower vapor pressure. There is also a relationship between the vapor pressure of a substance and its temperature. The quantitative relation between a substance’s vapor pressure and its temperature is described by the Clausius-Clapeyron equation:
P = Ae-ΔHvap/RT
where ΔHvap is the enthalpy of vaporization for the liquid, R is the gas constant, and A is a constant whose value depends on the chemical identity of the substance. This equation is often rearranged into logarithmic form to yield the linear equation:
ln(P) =  + ln(A)
This linear equation may be expressed in a two-point format that is convenient for use in various computations, as demonstrated in the example exercises that follow. If at temperature T1, the vapor pressure is P1, and at temperature T2, the vapor pressure is P2, the corresponding linear equations are:
ln(P1) =  + ln(A) and ln(P2) =
  + ln(A)
Since the constant, ln(A), is the same, these two equations may be rearranged to isolate ln(A) and then set them equal to one another:
ln(P1) +  = ln(P2) +
which can be combined into:

Example 4
Estimating Enthalpy of Vaporization
Isooctane (2,2,4-trimethylpentane) has an octane rating of 100. It is used as one of the standards for the octane-rating system for gasoline. At 34.0 °C, the vapor pressure of isooctane is 10.0 kPa, and at 98.8 °C, its vapor pressure is 100.0 kPa. Use this information to estimate the enthalpy of vaporization for isooctane.
Solution
The enthalpy of vaporization, ΔHvap, can be determined by using the Clausius-Clapeyron equation:
Since we have two vapor pressure-temperature values (T1 = 34.0 °C = 307.2 K, P1 = 10.0 kPa and T2 = 98.8 °C = 372.0 K, P2 = 100 kPa), we can substitute them into this equation and solve for ΔHvap. Rearranging the Clausius-Clapeyron equation and solving for ΔHvap yields:
ΔHvap =  = 33,800 J/mol = 33.8 kJ/mol
Note that the pressure can be in any units, so long as they agree for both P values, but the temperature must be in kelvin for the Clausius-Clapeyron equation to be valid.
Check Your Learning
At 20.0 °C, the vapor pressure of ethanol is 5.95 kPa, and at 63.5 °C, its vapor pressure is 53.3 kPa. Use this information to estimate the enthalpy of vaporization for ethanol.
Answer:
41,369 J/mol = 41.4 kJ/mol
Example 5
Estimating Temperature (or Vapor Pressure)
For benzene (C6H6), the normal boiling point is 80.1 °C and the enthalpy of vaporization is 30.8 kJ/mol. What is the boiling point of benzene in Denver, where atmospheric pressure = 83.4 kPa?
Solution
If the temperature and vapor pressure are known at one point, along with the enthalpy of vaporization, ΔHvap, then the temperature that corresponds to a different vapor pressure (or the vapor pressure that corresponds to a different temperature) can be determined by using the Clausius-Clapeyron equation:
Since the normal boiling point is the temperature at which the vapor pressure equals atmospheric pressure at sea level, we know one vapor pressure-temperature value (T1 = 80.1 °C = 353.3 K, P1 = 101.3 kPa, ΔHvap = 30.8 kJ/mol) and want to find the temperature (T2) that corresponds to vapor pressure P2 = 83.4 kPa. We can substitute these values into the Clausius-Clapeyron equation and then solve for T2. Rearranging the Clausius-Clapeyron equation and solving for T2 yields:
T2 = 
T2 = 346.9 K or 73.7 °C
Check Your Learning
For acetone (CH3)2CO, the normal boiling point is 56.5 °C and the enthalpy of vaporization is 31.3 kJ/mol. What is the vapor pressure of acetone at 25.0 °C?
Answer:
30.3 kPa
Key Concepts and Summary
Phase diagrams (plots of pressure vs. temperature) were correlated with heating curves (plots of temperature vs. energy). These two types of plots provide complementary information on the phase transitions of substances. While a heating curve provides information on the phase changes at a single pressure, the phase diagram depicts the phase changes at all temperatures and pressures. Phase diagrams can be used to determine and predict the phase of a substance at a given temperature and pressure and also the phase changes that will occur. One of these phase changes is vaporization, which is an endothermic process that transforms a liquid to a gas. We use the Clausius-Clapeyron equation to relate the enthalpy of vaporization with the vapor pressure of a substance.
Key Equations
- P = Ae-ΔHvap/RT
- ln(P) = + ln(A)
Glossary
- Clausius-Clapeyron equation
- mathematical relationship between the temperature, vapor pressure, and enthalpy of vaporization for a substance
- enthalpy of vaporization
- the energy change associated with the vaporization process
- normal boiling point
- temperature at which a liquid’s vapor pressure equals 1 atm (760 torr)
- vaporization
- change from liquid state to gaseous state
Chemistry End of Section Exercises
- Consider the phase diagram below.
- What is the vapor pressure of the solid at -60 °C?
- What phase change occurs when this substance at 40 atm pressure is heated from -80 °C to -40 °C?
- Evaporation of sweat requires energy and thus take excess heat away from the body. Some of the water that you drink may eventually be converted into sweat and evaporate. If you drink a 20-ounce bottle of water that had been in the refrigerator at 3.8 °C, how much heat is needed to convert all of that water into sweat and then to vapor? (Note: Your body temperature is 36.6 °C. For the purpose of solving this problem, assume that the thermal properties of sweat are the same as for water.)
- According to Figure 1, is it possible to boil water at room temperature (25 °C)? Explain.
- The vapor pressure of water is 1.0 atm at 373 K and the enthalpy of vaporization is 40.7 kJ/mol. What is the vapor pressure at 363 K? At 383 K?
- Given that at 40 °C the vapor pressure of ethanol is 150 mmHg and that the normal boiling point of ethanol is 78 °C, what is the enthalpy of vaporization for ethanol?
Answers to Chemistry End of Section Exercises
- (a) 4 atm; (b) Solid to liquid
- 1.4 × 10³ kJ
- Yes, you can boil water at room temperature. If you look at the phase diagram for water in Figure 1, at 25 °C, water can exist as a liquid or a gas, depending on the pressure. If we wanted to boil water without heating it up, we would need to start at a pressure, such as 1 atm, where the water exists as a liquid, then decrease the pressure until the liquid begins to boil. We also know from the previous module, that boiling occurs when the vapor pressure is equal to the surrounding pressure. The vapor pressure of water at 25 °C hasn’t changed, but the surrounding pressure has decreased. This results in the boiling of water at room temperature.
- 363 K: 0.697 atm; 383 K: 1.409 atm
- 39.0 kJ/mol
Please use this form to report any inconsistencies, errors, or other things you would like to change about this page. We appreciate your comments. 🙂
