
M13Q11: Catalysts; Connecting Mechanisms to Empirically-Determined Rate Laws; Catalysis; Critiques of Mechanisms
Learning Objectives
- Critique a provided reaction mechanism by determining whether it is in agreement with the experimentally determined stoichiometry of a reaction and the experimentally determined rate law.
- Sketch a reaction profile based on a provided mechanism, or critique a mechanism based on a provided reaction profile.
- Describe the role of catalysts in reactions, and from overall stoichiometry and the rate law, or from a reaction mechanism, determine whether a catalyst is involved in a reaction.
| Key Concepts and Summary | Glossary | End of Section Exercises |
Catalysts and Reaction Rates
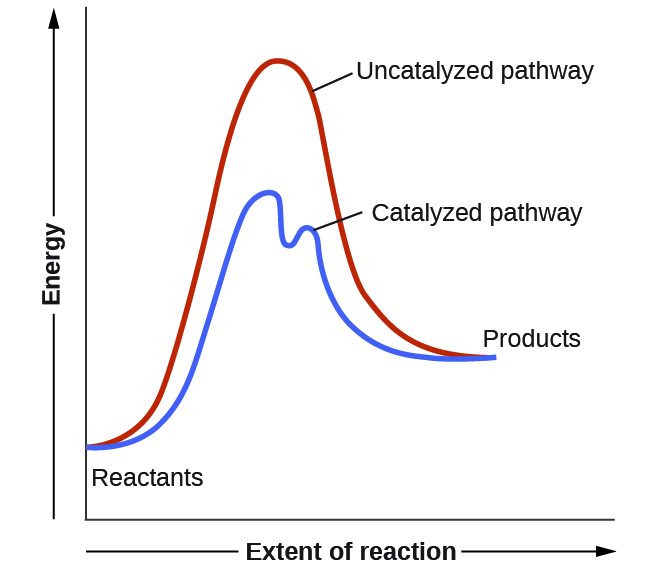
We have seen that the rate of many reactions can be accelerated by catalysts. Catalysts function by providing an alternate reaction mechanism that has a lower activation energy than would be found in the absence of the catalyst. In some cases, the catalyzed mechanism may include additional steps, as depicted in the reaction diagrams shown in Figure 1. This lower activation energy results in an increase in the rate of reaction as described by the Arrhenius equation. Note that a catalyst decreases the activation energy for both the forward and the reverse reactions and hence accelerates both the forward and the reverse reactions. Consequently, the presence of a catalyst will permit a system to reach equilibrium more quickly, but it has no effect on the position of the equilibrium as reflected in the value of its equilibrium constant (see the next chapter on chemical equilibrium).
Example 1
Using Reaction Diagrams to Compare Catalyzed Reactions
The two reaction diagrams here represent the same reaction: one without a catalyst and one with a catalyst. Identify which diagram suggests the presence of a catalyst, and determine the activation energy for the catalyzed reaction:
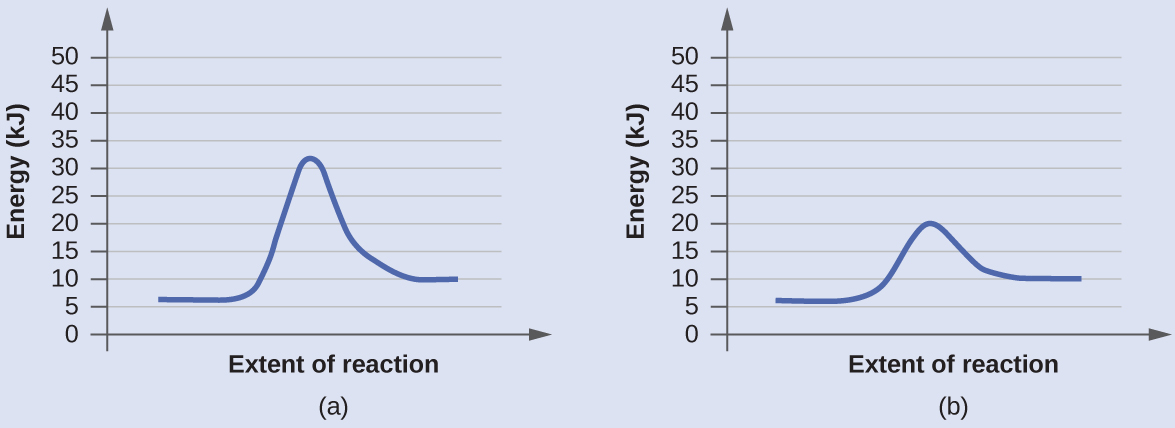
Solution
A catalyst does not affect the energy of reactant or product, so those aspects of the diagrams can be ignored. They are, as we would expect, identical in the two graphs. However, there is a noticeable difference in the energy of the transition state, which is distinctly lower in diagram (b) than it is in (a). This indicates the use of a catalyst in diagram (b). The activation energy is the difference between the energy of the starting reagents and the transition state—a maximum on the reaction coordinate diagram. The reagents are at 6 kJ and the transition state is at 20 kJ, so the activation energy can be calculated as follows:
Ea = 20 kJ – 6 kJ = 14 kJ
Check Your Learning
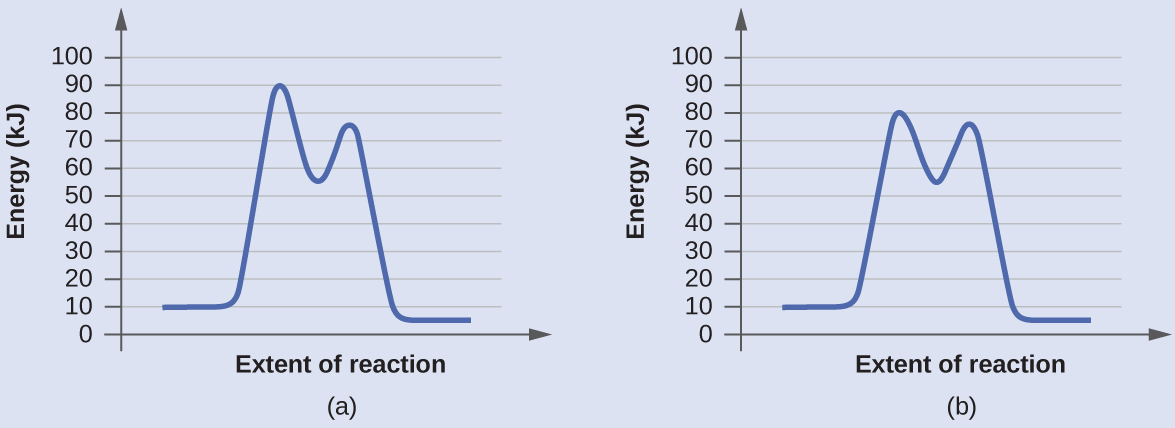
Determine which of the two diagrams here (both for the same reaction) involves a catalyst, and identify the activation energy for the catalyzed reaction:
Answer:
Diagram (b) is a catalyzed reaction with an activation energy of about 70 kJ.
Science in Real Life: Homogeneous and Heterogenous Catalysts
A homogeneous catalyst is present in the same phase as the reactants. It interacts with a reactant to form an intermediate substance, which then decomposes or reacts with another reactant in one or more steps to regenerate the original catalyst and form product.
As an important illustration of homogeneous catalysis, consider the earth’s ozone layer. Ozone in the upper atmosphere, which protects the earth from ultraviolet radiation, is formed when oxygen molecules absorb ultraviolet light and undergo the reaction:
3O2(g)  2O3(g)
Ozone is a relatively unstable molecule that decomposes to yield diatomic oxygen by the reverse of this equation. This decomposition reaction is consistent with the following mechanism:
O3 → O2 + O
O + O3 → 2 O2
The presence of nitric oxide, NO, influences the rate of decomposition of ozone. Nitric oxide acts as a catalyst in the following mechanism:
NO(g) + O3(g) → NO2(g) + O2(g)
O3(g) → O2(g) + O(g)
NO2(g) + O(g) → NO(g) + O2(g)
The overall chemical change for the catalyzed mechanism is the same as:
2 O3(g) → 3 O2(g)
The nitric oxide reacts and is regenerated in these reactions. It is not permanently used up; thus, it acts as a catalyst. The rate of decomposition of ozone is greater in the presence of nitric oxide because of the catalytic activity of NO. Certain compounds that contain chlorine also catalyze the decomposition of ozone.
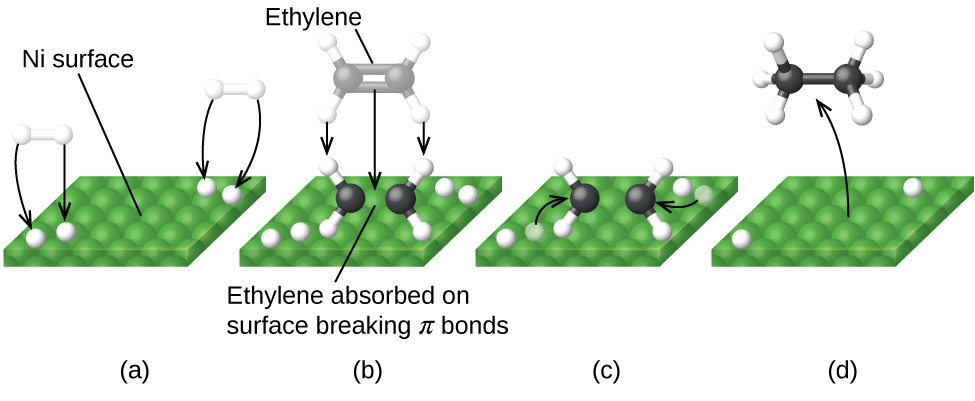
A heterogeneous catalyst is a catalyst that is present in a different phase (usually a solid) than the reactants. Such catalysts generally function by furnishing an active surface upon which a reaction can occur. Gas and liquid phase reactions catalyzed by heterogeneous catalysts occur on the surface of the catalyst rather than within the gas or liquid phase.
Figure 2 illustrates the steps that chemists believe to occur in the reaction of compounds containing a carbon–carbon double bond with hydrogen on a nickel catalyst. Nickel is the catalyst used in the hydrogenation of polyunsaturated fats and oils (which contain several carbon–carbon double bonds) to produce saturated fats and oils (which contain only carbon–carbon single bonds).
Science in Real Life: Enzyme Structure and Function
The study of enzymes is an important interconnection between biology and chemistry. Enzymes are usually proteins (polypeptides) that help to control the rate of chemical reactions between biologically important compounds, particularly those that are involved in cellular metabolism.
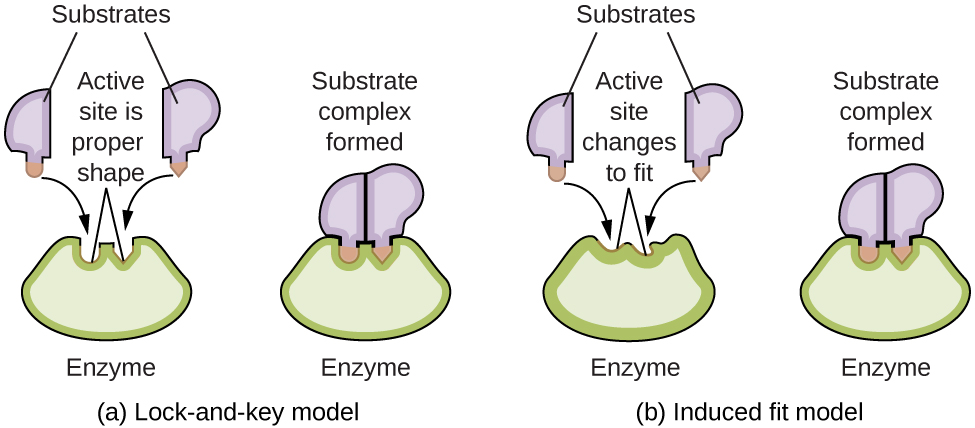
Enzyme molecules possess an active site, a part of the molecule with a shape that allows it to bond to a specific substrate (a reactant molecule), forming an enzyme-substrate complex as a reaction intermediate. There are two models that attempt to explain how this active site works. The most simplistic model is referred to as the lock-and-key hypothesis, which suggests that the molecular shapes of the active site and substrate are complementary, fitting together like a key in a lock. The induced fit hypothesis, on the other hand, suggests that the enzyme molecule is flexible and changes shape to accommodate a bond with the substrate. This is not to suggest that an enzyme’s active site is completely malleable, however. Both the lock-and-key model and the induced fit model account for the fact that enzymes can only bind with specific substrates, since in general a particular enzyme only catalyzes a particular reaction (Figure 3).

The Royal Society of Chemistry provides an excellent introduction to enzymes for students and teachers.
Key Concepts and Summary
To begin this chapter, we looked at the four factors that can influence the rate of the reaction. We use rate laws to see concentration’s and phase’s effect and we can use the Arrhenius equation to see how temperature affects the rate (through the rate constant). In this section, catalyst’s effect on the activation energy is studied. By changing the mechanism and lowering the activation energy, catalysts always increase the rate of a reaction. If the concentration of the catalyst is not included in the rate law, the catalyst changes the rate constant.
Glossary
- heterogeneous catalyst
- a catalyst present in a different phase than the reactants
- homogeneous catalyst
- a catalyst present in the same phase as the reactants
Chemistry End of Section Exercises
- Account for the increase in reaction rate brought about by a catalyst.
- Consider this scenario and answer the following questions: Chlorine atoms resulting from decomposition of chlorofluoromethanes, such as CCl2F2, catalyze the decomposition of ozone in the atmosphere. One simplified mechanism for the decomposition is:
Step 1: O3 ⟶ O2 + O Step 2: O3 + Cl ⟶ O2 + ClO Step 3: ClO + O ⟶ Cl +O2 - Explain why chlorine atoms are catalysts.
- Is ClO a catalyst?
- When the concentration of H+(aq) is doubled in the reaction below,
H2O2(aq) + 2 Fe2+(aq) + 2 H+(aq) → 2 Fe3+(aq) + 2 H2O(g)
there is no change in the reaction rate. This indicates that
- the rate-determining step does not involve H+.
- the reaction mechanism does not involve H+.
- H+ is a catalyst.
- H+ is an intermediate.
- the rate law is first order with respect to H+.
- Which of the following effects can result from addition of a catalyst to a reaction system? Select all that apply.
- An increase in the reaction activation energy
- A decrease in the change in enthalpy of the reaction
- The formation of different intermediates
- Which of the following statements about the rate constant, k, is false? Select all that apply.
- k increases as temperature increases.
- k decreases as activation energy increases.
- k increases as reactant concentrations increases.
- k can be increased by adding a catalyst.
- The reaction rate increases as k increases.
Answers to Chemistry End of Section Exercises
- The general mode of action for a catalyst is to provide a mechanism by which the reactants can unite more readily by taking a path with a lower reaction energy.
- (a) Chlorine atoms are a catalyst because they react in the second step but are regenerated in the third step. Thus, they are not used up, which is a characteristic of catalysts.
(b) No, ClO is an intermediate, not a catalyst. It is created in step 2 and used is step 3. - A
- C
- C
Please use this form to report any inconsistencies, errors, or other things you would like to change about this page. We appreciate your comments. 🙂
