
M7Q9: Periodic Trends
Introduction
This section explores size (radius) of atoms and ions, ionization energies and electron affinities, properties which vary periodically as the electronic structure of the elements changes. Therefore, examining these properties reveals trends dictating the organization of the Periodic Table. This section includes worked examples, a glossary, and practice problems.
Learning Objectives for Periodic Trends
- Correlate the effective nuclear charge with selected trends in periodic properties.
| Electron Configurations and Chemical Reactivity | Variation in Atomic Radius | Variation in Ionization Energies | Variation in Electron Affinities |
| Key Concepts and Summary | Glossary | End of Section Exercises |
Electron Configurations and Chemical Reactivity
As described earlier, the Periodic Table arranges atoms based on increasing atomic number so that elements with the same chemical properties recur periodically. Because they are in the outer shells of an atom, valence electrons play the most important role in chemical reactions. The valence electrons (outer electrons) have the highest energy of the electrons in an atom and are more easily lost or shared than the core electrons. Valence electrons are also the determining factor in some physical properties of the elements.
Elements in any one group (or column) have the same number of valence electrons; the alkali metals (e.g. lithium and sodium) each have only one valence electron, the alkaline earth metals (e.g. beryllium and magnesium) each have two, and the halogens (e.g. fluorine and chlorine) each have seven valence electrons. The similarity in chemical properties among elements of the same group occurs because they have the same number of valence electrons. It is the loss, gain, or sharing of valence electrons that defines how elements react.
It is important to remember that the Periodic Table was developed on the basis of the chemical behavior of the elements, well before any idea of their atomic structure was available. Now we can understand why the Periodic Table has the arrangement it has—the arrangement puts elements whose atoms have the same number of valence electrons in the same group. This arrangement is emphasized in Figure 1, which shows, in Periodic-Table form, the electron configuration of the last subshell to be filled by the Aufbau principle. The colored sections of Figure 1 show the three categories of elements classified by the orbitals being filled: main group, transition, and inner transition elements. These classifications determine which orbitals are counted in the valence shell, or highest energy level orbitals of an atom.
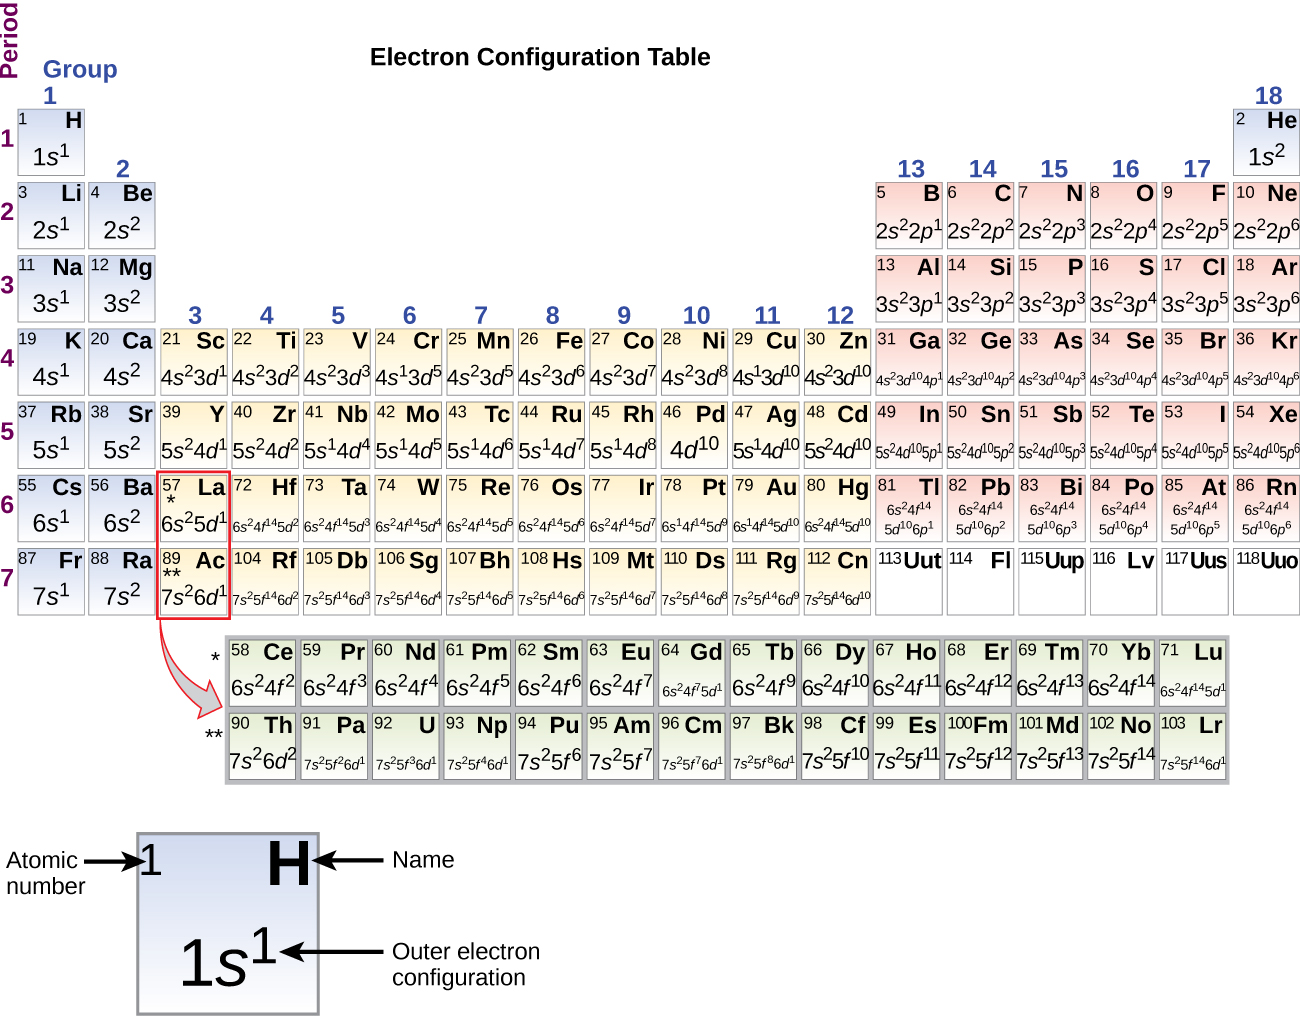
- Main group elements (sometimes called representative elements) are those in which the last electron added enters an s or a p orbital in the outermost shell, shown in blue and red in Figure 1. This category includes all the nonmetallic elements, as well as many metals and the intermediate semimetallic elements. The valence electrons for main group elements are those with the highest n level. For example, gallium (Ga, atomic number 31) has the electron configuration [Ar]4s23d104p1, which contains three valence electrons (underlined). The completely filled d orbitals count as core, not valence, electrons.
- Transition elements or transition metals. These are metallic elements in which the last electron added enters a d orbital. The valence electrons (those added after the last noble gas configuration) in these elements include the ns and (n – 1) d electrons. The official IUPAC definition of transition elements specifies those with partially filled d orbitals. Thus, the elements with completely filled orbitals (Zn, Cd, Hg, as well as Cu, Ag, and Au in Figure 1) are not technically transition elements. However, the term is frequently used to refer to the entire d block (colored yellow in Figure 1), and we will adopt this usage in this textbook.
- Inner transition elements are metallic elements in which the last electron added occupies an f orbital. They are shown in green in Figure 1. The valence shells of the inner transition elements consist of the (n – 2)f, the (n – 1)d, and the ns subshells. There are two inner transition series:
- The lanthanide series: lanthanum (La) through lutetium (Lu)
- The actinide series: actinium (Ac) through lawrencium (Lr)
Lanthanum and actinium, because of their similarities to the other members of the series, are included and used to name the series, even though they are transition metals with no f electrons.
Variation in Atomic Radius
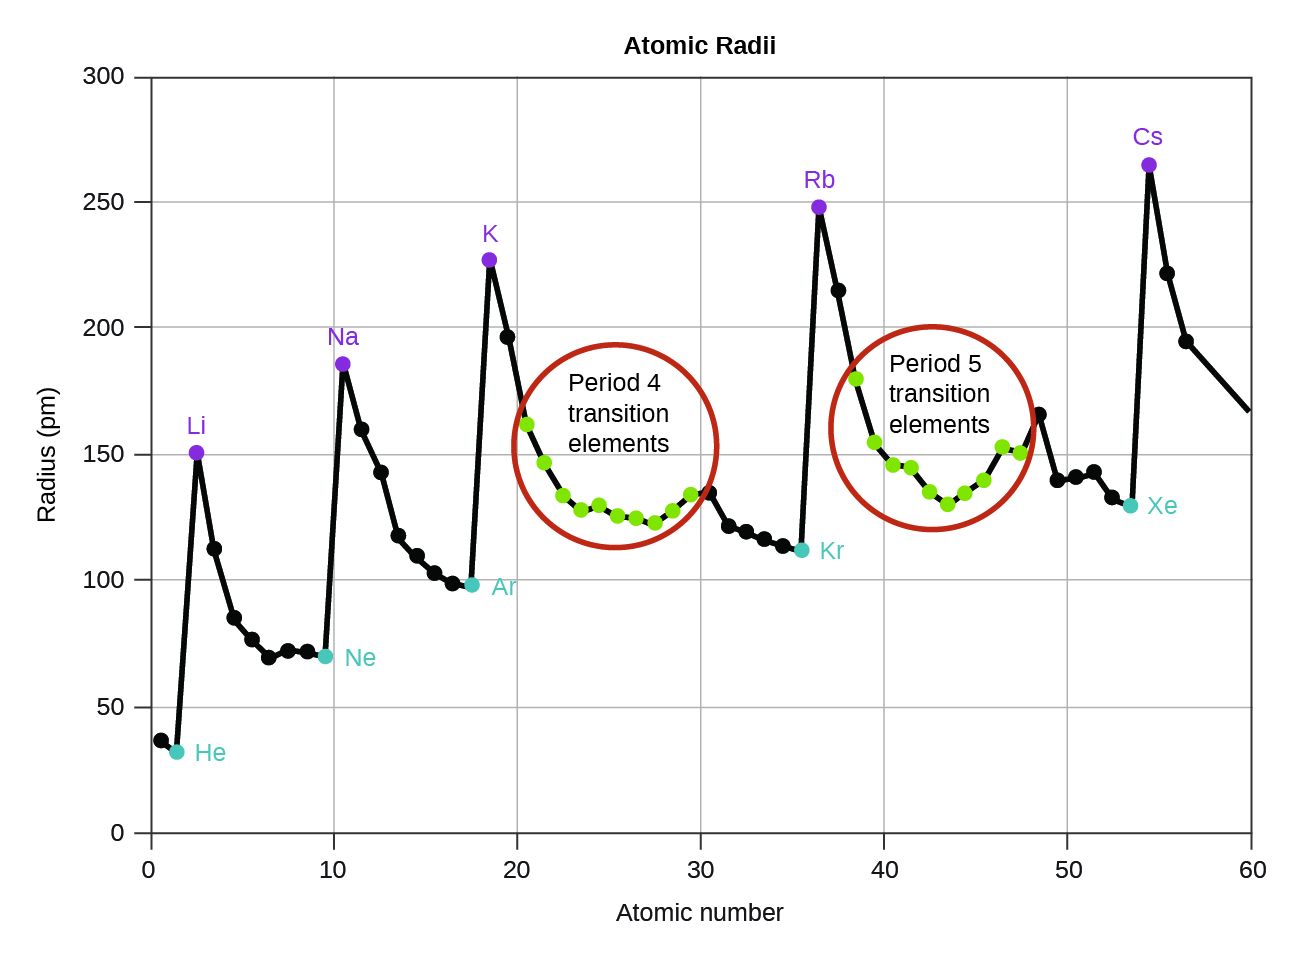
The quantum mechanical picture makes it difficult to establish a definite size of an atom. However, there are several practical ways to define the radius of atoms and, thus, determine their relative sizes that give roughly similar values. We will use the atomic radii (Figure 2), which is defined as one-half the distance between the nuclei of two identical atoms when they are joined by a covalent bond (this measurement is possible because atoms within molecules still retain much of their atomic identity). We know that as we scan down a group, the principal quantum number, n, increases by one for each element. Thus, the electrons are being added to a region of space that is increasingly distant from the nucleus. Consequently, the size of the atom (and its atomic radius) must increase as we increase the distance of the outermost electrons from the nucleus. This trend is illustrated for the atomic radii of the halogens in Table 1 and Figure 2. The trends for the entire periodic table can be seen in Figure 2.
| Atom | Atomic radius (pm) | Nuclear charge |
| F | 71 | +9 |
| Cl | 99 | +17 |
| Br | 114 | +35 |
| I | 133 | +53 |
| At | 166 | +85 |
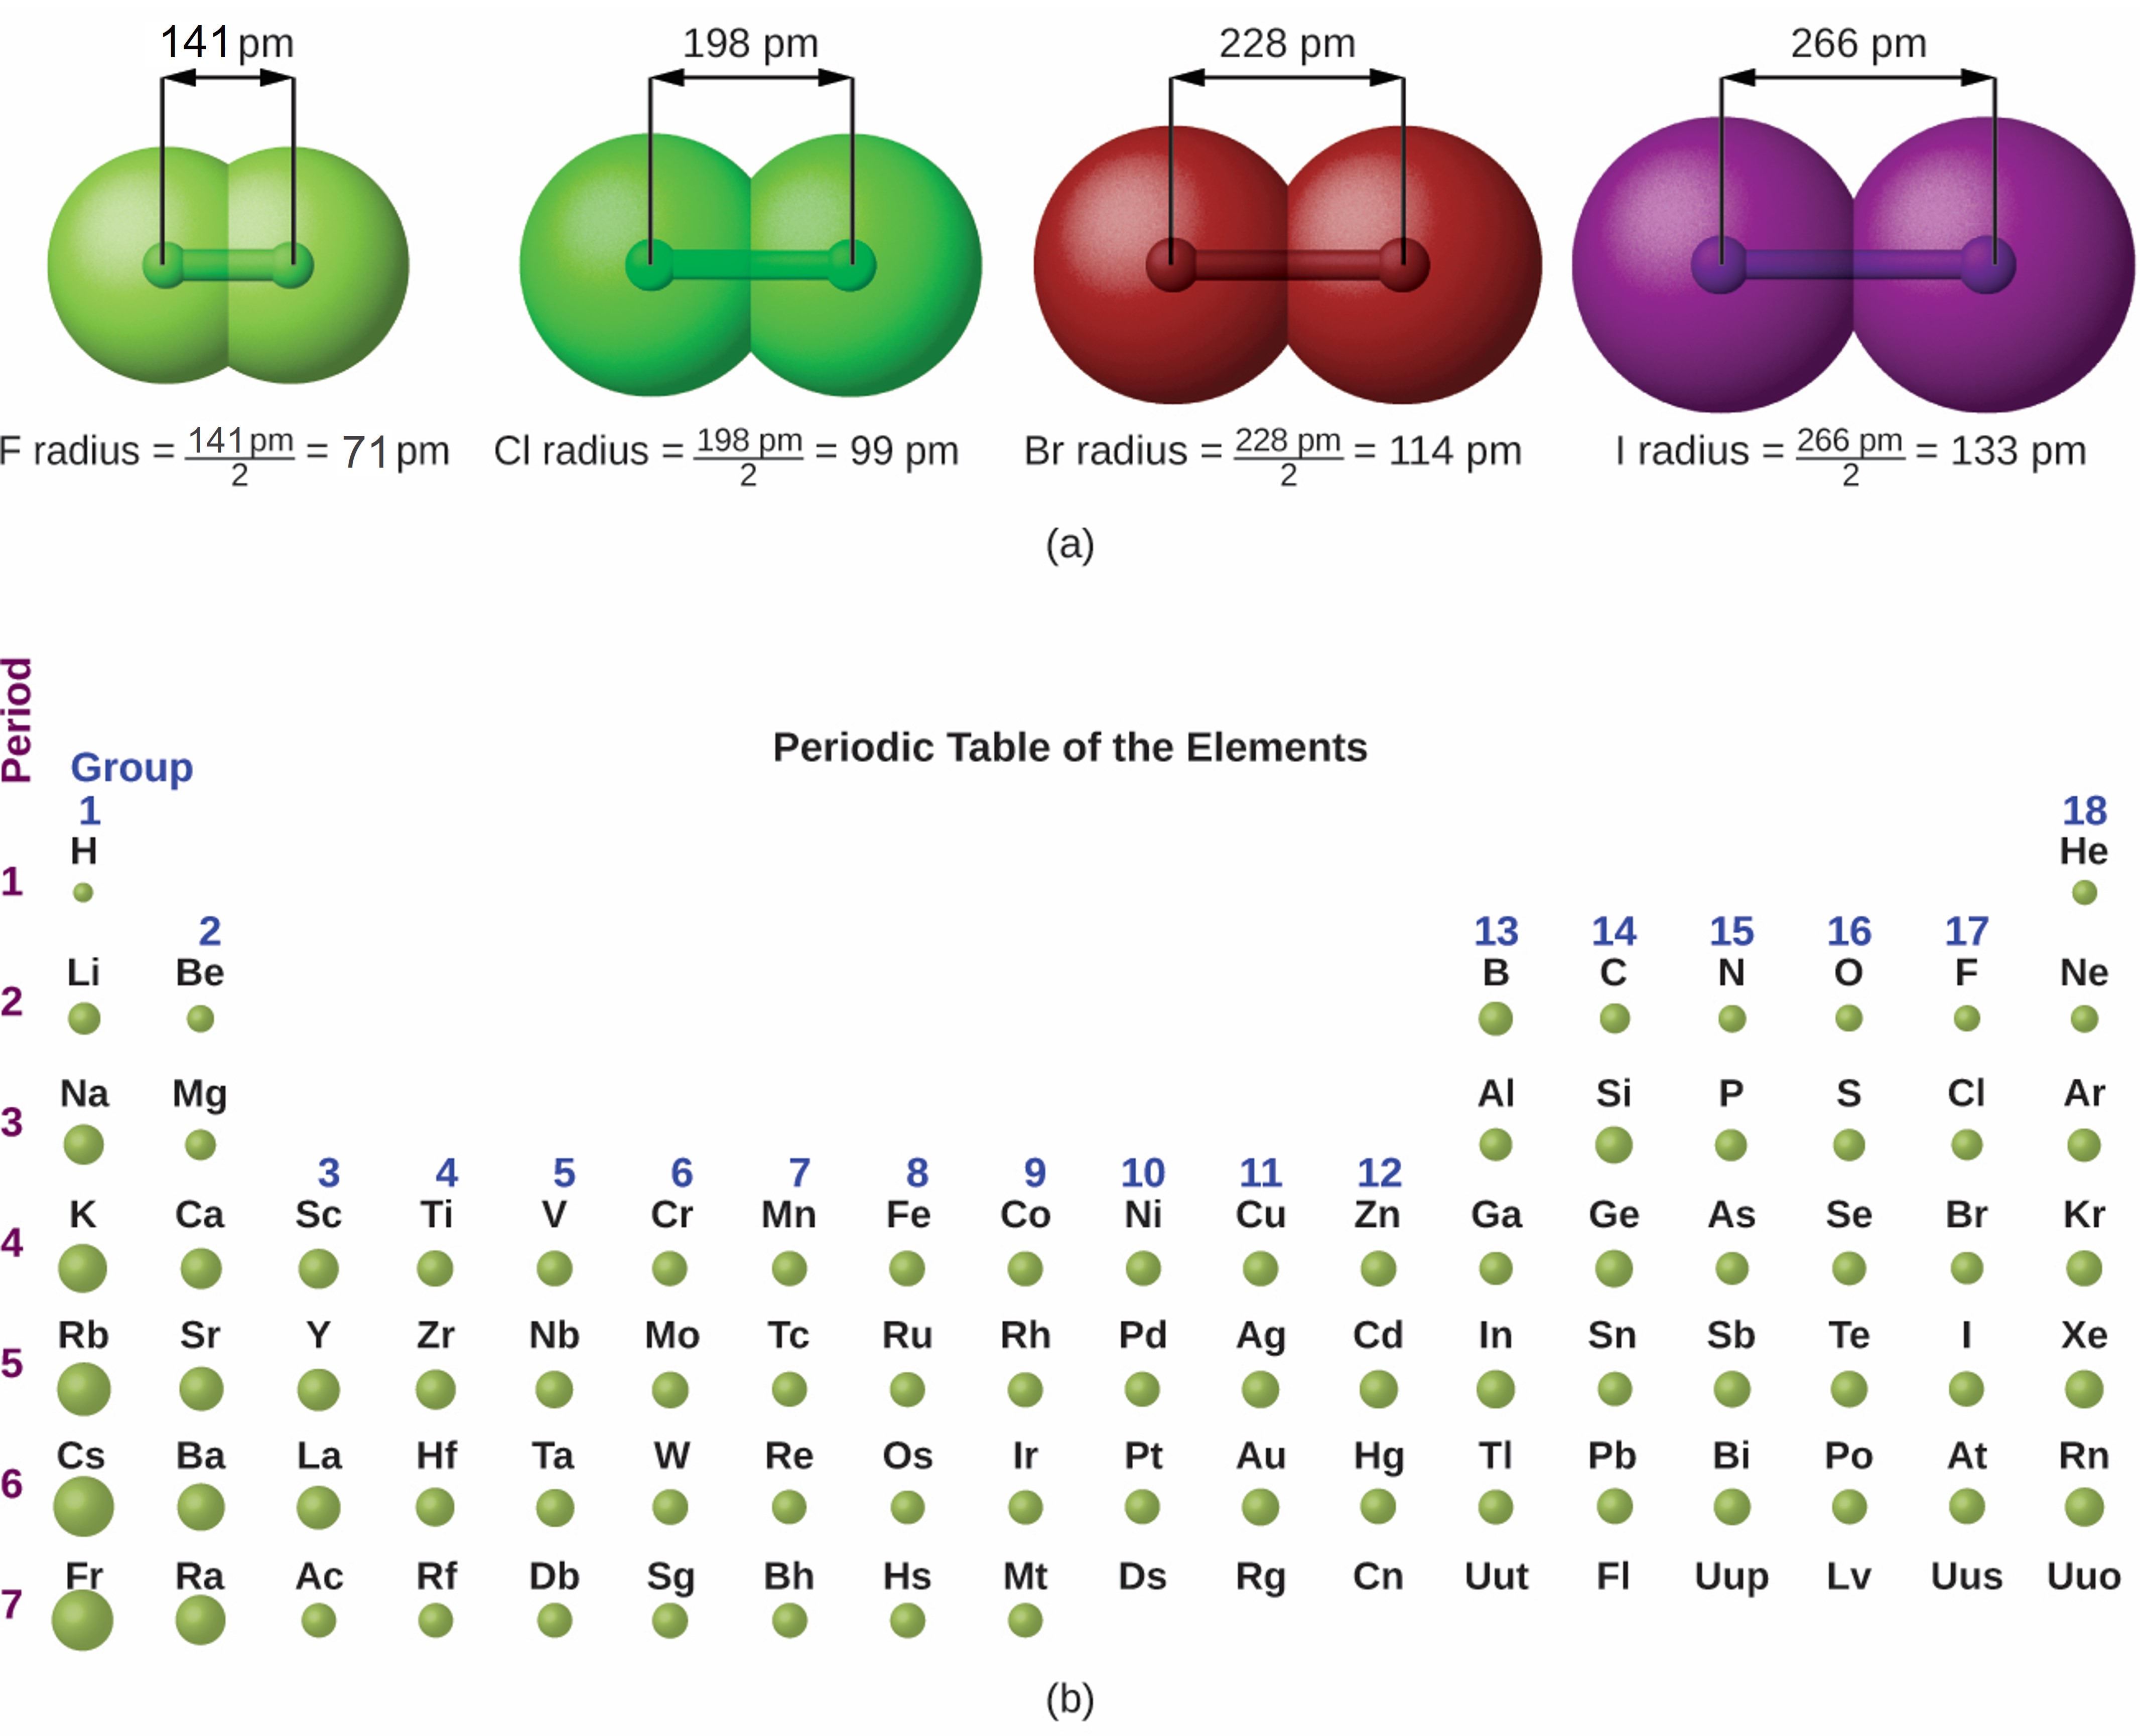
As shown in Figure 2, as we move across a period from left to right, we generally find that each element has a smaller atomic radius than the element preceding it. This is expected due to the Zeff for the valence electron increasing from left to right across a period. The stronger pull (higher effective nuclear charge) experienced by valence electrons on the right side of the periodic table draws them closer to the nucleus, making the atomic radii smaller.

Explore visualizations of the periodic trends discussed in this section (and many more trends). With just a few clicks, you can create three-dimensional versions of the periodic table showing atomic size or graphs of ionization energies from all measured elements.
Example 1
Sorting Atomic Radii
Predict the order of increasing atomic radius for Ge, Fl, Br, Kr.
Solution
Radius increases as we move down a group, so Ge < Fl (Note: Fl is the symbol for flerovium, element 114, NOT fluorine). Radius decreases as we move across a period, so Kr < Br < Ge. Putting the trends together, we obtain Kr < Br < Ge < Fl.
Check Your Learning
Give an example of an atom whose size is smaller than fluorine.
Answer:
Ne or He
Variation in Ionization Energies
The amount of energy required to remove the most loosely bound electron from a gaseous atom in its ground state is called its first ionization energy (IE1). The first ionization energy for an element, X, is the energy required to form a cation with +1 charge:
IE1: X(g) → X+(g) + e–
The energy required to remove the second most loosely bound electron is called the second ionization energy (IE2).
IE2: X+(g) → X2+(g) + e–
The energy required to remove the third electron is the third ionization energy, and so on. Energy is always required to remove electrons from atoms or ions, so ionization processes are endothermic and IE values are always positive. Recall that Zeff for valence electrons increases from left to right on the Periodic Table but that atoms get larger down a group as the n level increases. Relating this to the IE, we would expect valence electrons that are less tightly held (i.e., experience a lower Zeff) would be easier to remove and require less energy. Therefore, as Zeff for the valence electrons increases from left to right, the first IE increases, too, because more energy will be required to remove the electrons. As the n level for the valence electrons increases down a group, the atoms get bigger and the Coulombic attraction between the nucleus and valence electrons decreases. The valence electrons become easier to remove and the first ionization energy decreases.
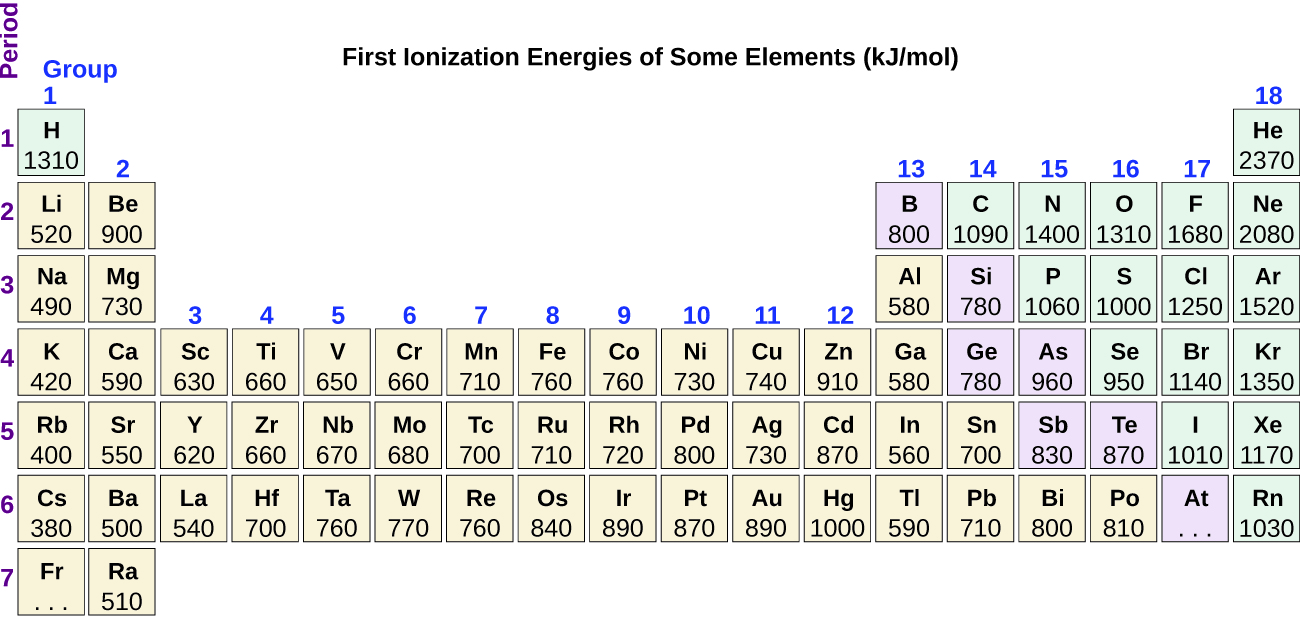
Figure 4 graphs the relationship between the first ionization energy and the atomic number of several elements. The values of first ionization energy for the elements are given in Figure 5. Within a period, the IE1 generally increases with increasing Z. Down a group, the IE1 value generally decreases with atomic radius. There are some systematic deviations from this trend, however. Note that the ionization energy of boron (atomic number 5) is less than that of beryllium (atomic number 4) even though the nuclear charge of boron is greater by one proton. This can be explained because the energy of the subshells increases as l increases, due to penetration and shielding. Within any one shell, the s electrons are lower in energy than the p electrons. This means that an s electron is harder to remove from an atom than a p electron in the same shell. The electron removed during the ionization of beryllium ([He]2s2) is an s electron, whereas the electron removed during the ionization of boron ([He]2s22p1) is a p electron; this results in a lower first ionization energy for boron, even though its nuclear charge is greater by one proton. Thus, we see a small deviation from the predicted trend occurring each time a new subshell begins.
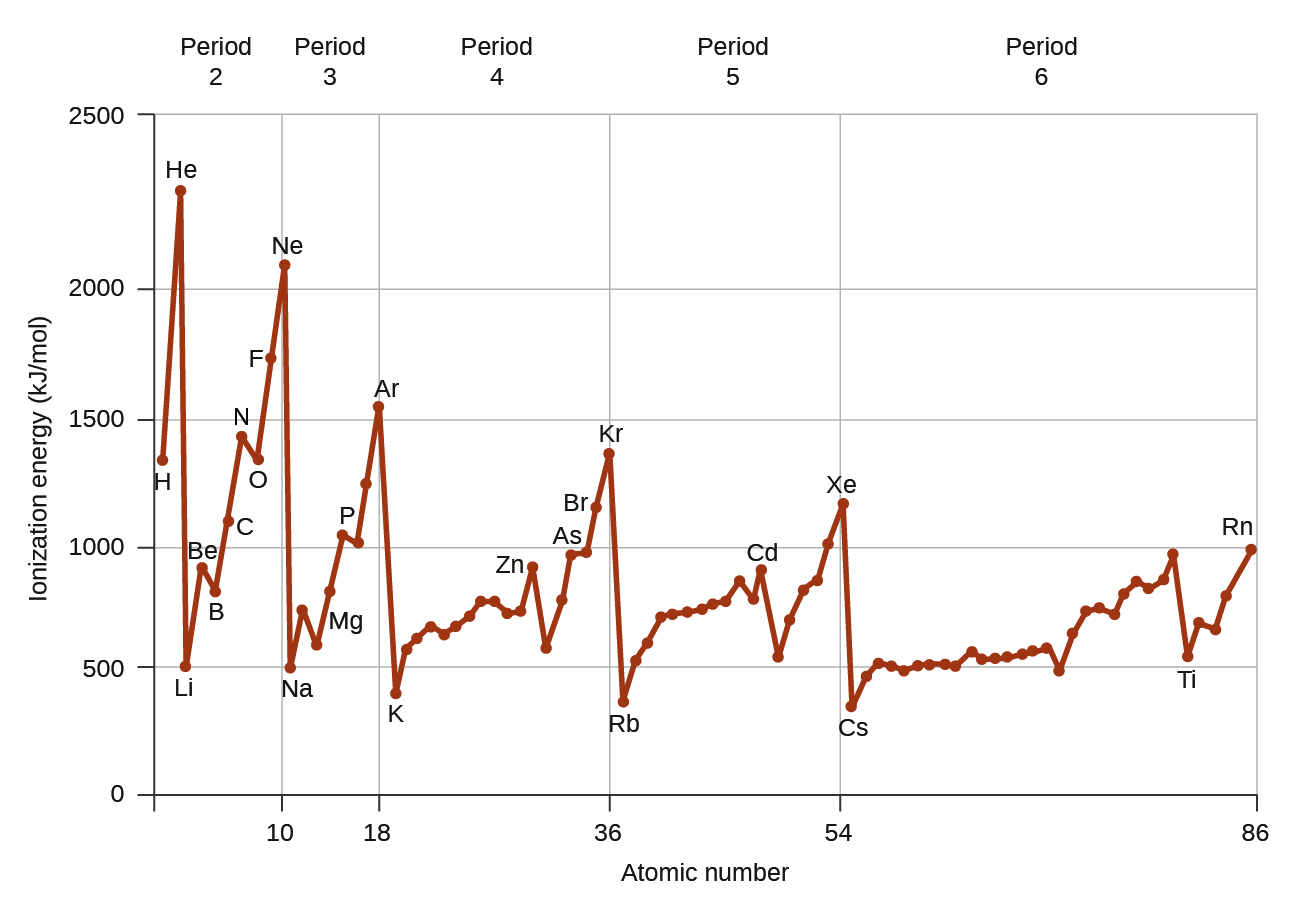
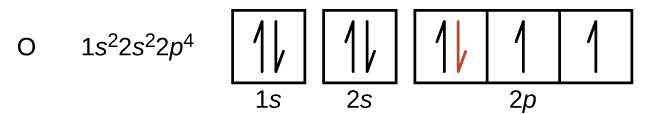
Another deviation occurs as orbitals become more than one-half filled. The first ionization energy for oxygen is slightly less than that for nitrogen, despite the trend in increasing IE1 values across a period. Looking at the orbital diagram of oxygen, we can see that removing one electron will eliminate the electron–electron repulsion caused by pairing the electrons in the 2p orbital and will result in a half-filled orbital (which is energetically favorable). Analogous changes occur in succeeding periods (note the dip for sulfur after phosphorus in Figure 5).
Removing an electron from a cation is more difficult than removing an electron from a neutral atom because of the greater electrostatic attraction to the cation. Likewise, removing an electron from a cation with a higher positive charge is more difficult than removing an electron from a cation with a lower charge. Thus, successive ionization energies for one element always increase. As seen in Table 2, there is a large increase in the ionization energies for each element. This jump corresponds to removal of the core electrons, which are harder to remove than the valence electrons due to the increase in Zeff felt by the core electrons. For example, Sc and Ga both have three valence electrons, so the rapid increase in ionization energy occurs after the third ionization.
| Element | IE1 | IE2 | IE3 | IE4 | IE5 | IE6 | IE7 |
| K | 418.8 | 3051.8 | 4419.6 | 5876.9 | 7975.5 | 9590.6 | 11343 |
| Ca | 589.8 | 1145.4 | 4912.4 | 6490.6 | 8153.0 | 10495.7 | 12272.9 |
| Sc | 633.1 | 1235.0 | 2388.7 | 7090.6 | 8842.9 | 10679.0 | 13315.0 |
| Ga | 578.8 | 1979.4 | 2964.6 | 6180 | 8298.7 | 10873.9 | 13594.8 |
| Ge | 762.2 | 1537.5 | 3302.1 | 4410.6 | 9021.4 | Not available | Not available |
| As | 944.5 | 1793.6 | 2735.5 | 4836.8 | 6042.9 | 12311.5 | Not available |
Example 2
Ranking Ionization Energies
Predict the order of increasing energy for the following processes: IE1 for Al, IE1 for Tl, IE2 for Na, IE3 for Al.
Solution
Removing the 6p1 electron from Tl is easier than removing the 3p1 electron from Al because the higher n orbital is farther from the nucleus, so IE1(Tl) < IE1(Al). Ionizing the third electron from Al (Al2+ → Al3+ + e–) requires more energy because the cation Al2+ exerts a stronger pull on the electron than the neutral Al atom, so IE1(Al) < IE3(Al). The second ionization energy for sodium removes a core electron, which is a much higher energy process than removing valence electrons. Putting this all together, we obtain: IE1(Tl) < IE1(Al) < IE3(Al) < IE2(Na).
Check Your Learning
Which has the lowest value for IE1: O, Po, Pb, or Ba?
Answer:
Ba
Variation in Electron Affinities
The electron affinity (EA) is the energy change for the process of adding an electron to a gaseous atom to form an anion (negative ion).
EA1: X(g) + e– → X–(g)
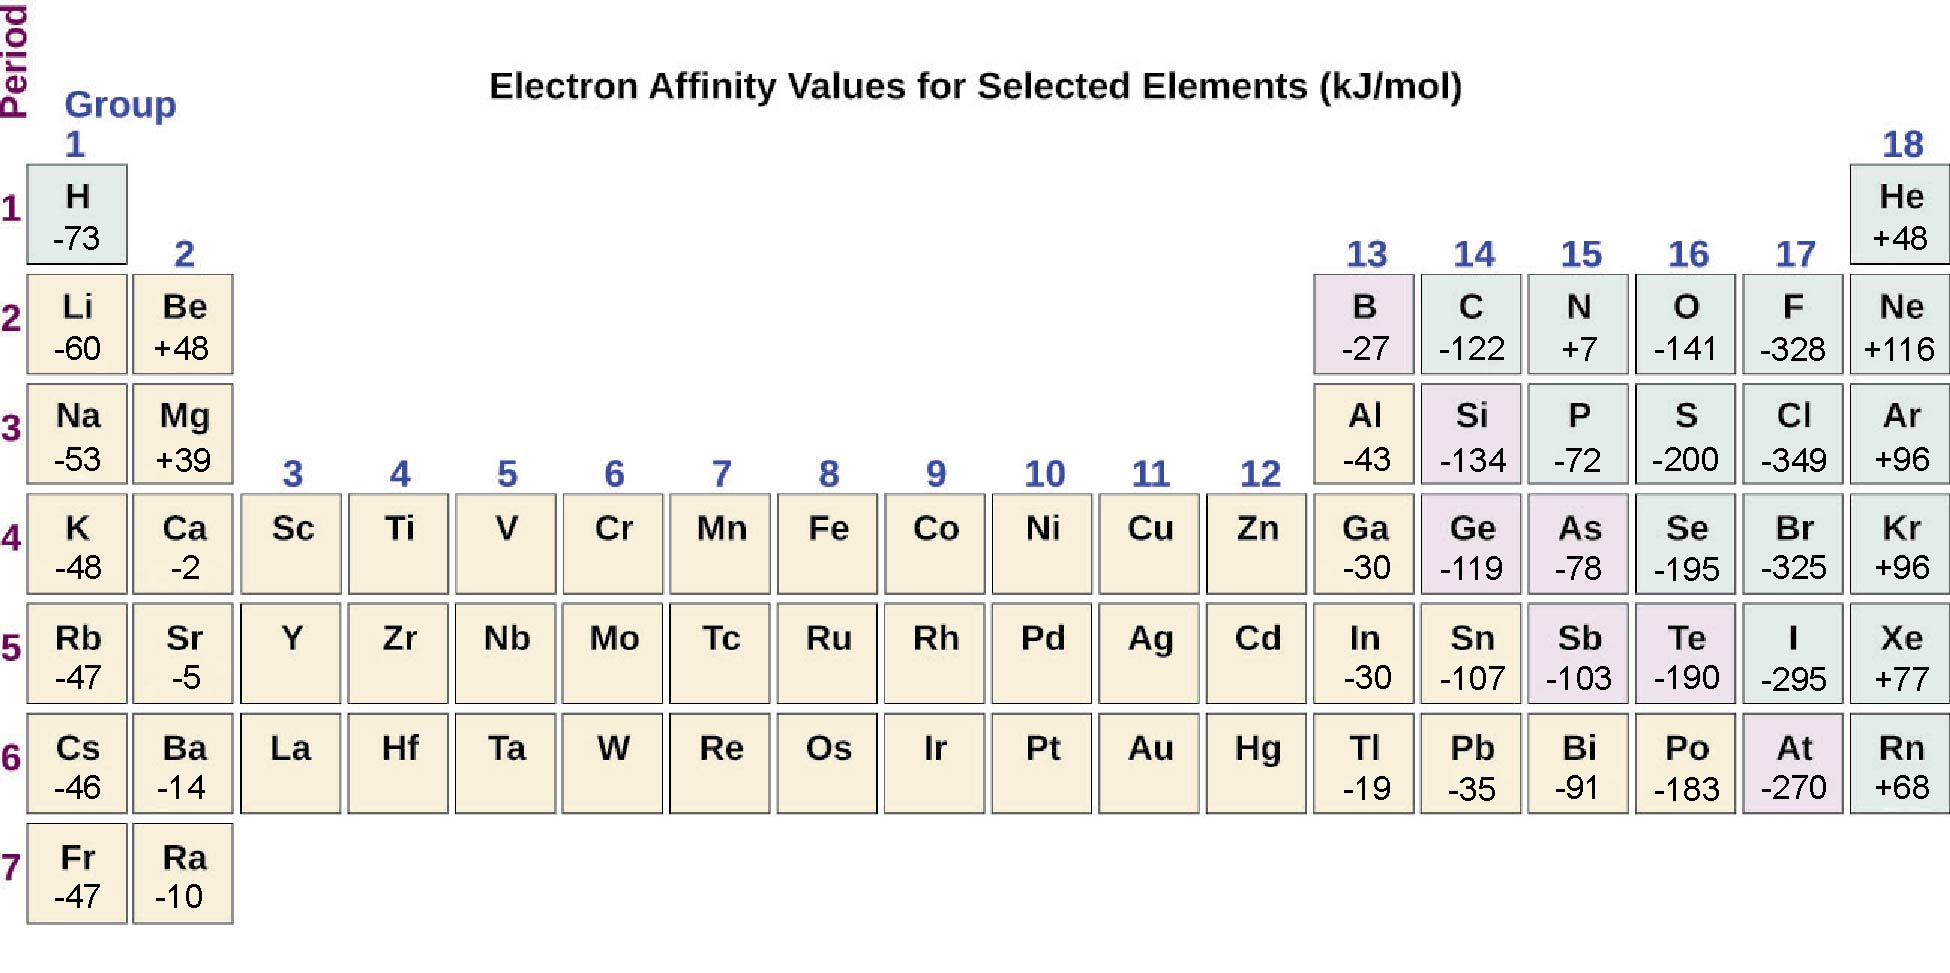
This process is exothermic for the majority of elements, which means that energy is released when the gaseous atom accepts an electron to form an anion. However, for certain elements the electron affinity for the addition of the first electron is >0, an indication that the atom will not bind an electron and form a stable negative ion. The EA of some of the elements is given in Figure 6. Subsequent EA values are associated with forming ions with more charge. The second EA is the energy associated with adding an electron to an anion to form a –2 ion, and so on.
As we might predict, it becomes easier to add an electron across a series of atoms as the effective nuclear charge of the atoms increases. We find, as we go from left to right across a period, EAs tend to become more negative. The exceptions found among the elements of group 2 (2A), group 15 (5A), and group 18 (8A) can be understood based on the electronic structure of these groups. The noble gases, group 18 (8A), have a completely filled shell and the incoming electron must be added to a higher n level, which is impossible to do. Group 2 (2A) has a filled ns subshell, and so the next electron added goes into the higher energy np, so, again, the observed EA value is not as the trend would predict. Finally, group 15 (5A) has a half-filled np subshell and the next electron must be paired with an existing np electron. In all of these cases, the initial relative stability of the electron configuration disrupts the trend in EA.
We also might expect the atom at the top of each group to have the largest EA; their first ionization potentials suggest that these atoms have the largest effective nuclear charges. However, as we move down a group, we see that the second element in the group most often has the greatest EA. The reduction of the EA of the first member can be attributed to the small size of the n = 2 shell and the resulting large electron–electron repulsions. For example, chlorine, with an EA value of –349 kJ/mol, has the highest value of any element in the Periodic Table. The EA of fluorine is –328 kJ/mol. When we add an electron to a fluorine atom to form a fluoride anion (F–), we add an electron to the n = 2 shell. The electron is attracted to the nucleus, but there is also significant repulsion from the other electrons already present in this small valence shell. The chlorine atom has the same electron configuration in the valence shell, but because the entering electron is going into the n = 3 shell, it occupies a considerably larger region of space and the electron–electron repulsions are reduced. The entering electron does not experience as much repulsion and the chlorine atom accepts an additional electron more readily.
The properties discussed in the previous section and this section (effective nuclear charge, size of atoms and ions, ionization energies, and electron affinities) are central to understanding chemical reactivity. For example, because fluorine has an energetically favorable EA and a large energy barrier to ionization (IE), it is much easier to form fluorine anions than cations. Metallic properties including conductivity and malleability (the ability to be formed into sheets) depend on having electrons that can be removed easily. Thus, metallic character increases as we move down a group and decreases across a period in the same trend observed for atomic size because it is easier to remove an electron that is farther away from the nucleus.
Key Concepts and Summary
Because valence electrons are held more tightly on the right side of the Periodic Table, the atomic radius decreases across a period. Atomic radius increases as we move down a group because the n level (orbital size) increases. Ionization energy (the energy associated with forming a cation) decreases down a group and mostly increases across a period because it is easier to remove an electron from a larger, higher energy orbital. Electron affinity (the energy associated with forming an anion) is more favorable (exothermic) when electrons are placed into lower energy orbitals, closer to the nucleus. Therefore, electron affinity becomes increasingly negative as we move left to right across the Periodic Table and becomes less negative as we move down a group. For both IE and electron affinity data, there are exceptions to the trends when dealing with completely filled or half-filled subshells.
Glossary
- atomic radius
- one-half the distance between the nuclei of two identical atoms when they are joined by a covalent bond
- electron affinity
- energy required to add an electron to a gaseous atom to form an anion
- ionization energy
- energy required to remove an electron from a gaseous atom or ion. The associated number (e.g., second ionization energy) corresponds to the charge of the ion produced (X2+)
Chemistry End of Section Exercises
- Based on their positions in the periodic table, predict which has the smallest atomic radius: Mg, Sr, Si, Cl, I.
- Based on their positions in the periodic table, predict which has the largest atomic radius: Li, Rb, N, F, I.
- Based on their positions in the periodic table, list the following atoms in order of increasing radius: Mg, Ca, Rb, Cs.
- Based on their positions in the periodic table, list the following atoms in order of increasing radius: Sr, Ca, Si, Cl.
- For the atoms with the following ground state electron configurations, which has the largest atomic radius?
- [Ar] 4s1
- [Ne] 3s2 3p5
- [Ar] 4s2 3d10 4p4
- [Ne] 3s1
- [Ar] 4s2 3d7
- Of the five elements Sn, Si, Sb, O, Te, which has the most endothermic reaction? (E represents an atom.)
E(g) → E+(g) + e–
What name is given to the energy for the reaction?
- Of the five elements Al, Cl, I, Na, Rb, which has the most exothermic reaction? (E represents an atom.)
E+(g) + e– → E(g)
What name is given to the energy for the reaction? Hint: note the process depicted does not correspond to electron affinity.
- Determine whether the reactions below are endothermic or exothermic.
- C(g) + e– → C–(g)
- I–(g) + e– → I2–(g)
- K(g) → K+(g) + e–
- 2 Br(g) → Br2(g)
- Which main group atom would be expected to have the lowest second ionization energy?
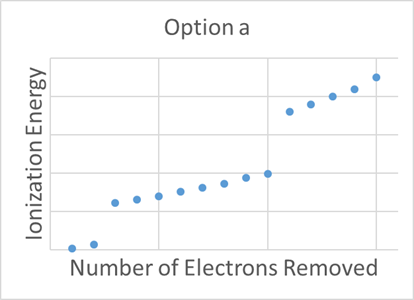
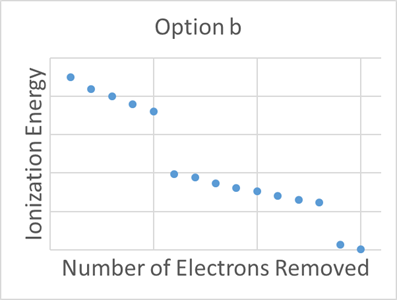
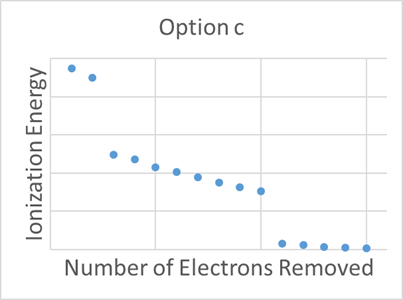
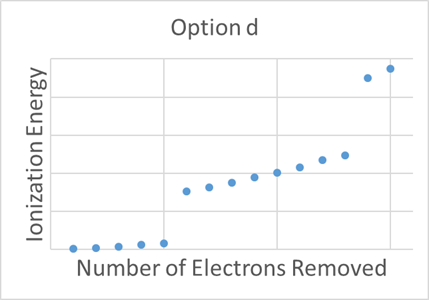
- Which of the following graphs represents the successive ionization energies (IE) for phosphorus plotted against the number of electrons removed?
- Which of the following has the largest change in energy?
- Ge4+(g) → Ge5+(g) + e–
- As4+(g) → As5+(g) + e–
- Se4+(g) → Se5+(g) + e–
- Sn4+(g) → Sn5+(g) + e–
- Sb4+(g) → Sb5+(g) + e–
Answers to Chemistry End of Section Exercises
- Cl
- Rb
- Mg < Ca < Rb < Cs
- Cl < Si < Ca < Sr
- A
- O, IE1
- Cl, -IE1
- (a) exothermic; (b) endothermic; (c) endothermic; (d) exothermic
- Ra
- D
- A
Please use this form to report any inconsistencies, errors, or other things you would like to change about this page. We appreciate your comments. 🙂
