
M7Q2: Photoelectric Effect
Introduction
Although Albert Einstein is most famous for his theories of relativity, he won the Nobel prize for resolving a paradox known as the photoelectric effect. This section follows Einstein’s findings and the discovery of light’s dual nature as both a wave (which you learned about in the previous section) and particle. This section includes worked examples, sample problems, and a glossary.
Learning Objectives for the Photoelectric Effect
- Evaluate the evidence for the particle nature of light as revealed by the photoelectric effect.
| Photoelectric Effect | Blackbody Radiation and the Ultraviolet Catastrophe |
| Key Concepts and Summary | Key Equations | Glossary | End of Section Exercises |
The Photoelectric Effect
It had been observed since the late 1800s that electrons could be ejected from the clean surface of a metal if irradiated with light. This phenomenon is called the photoelectric effect (Figure 1). Scientists observed that electrons could only be ejected when the frequency of the incident light was greater than some threshold frequency, and that the kinetic energy of the ejected electrons increased with increasing frequency of the incident light. The electrons in the metal had a certain amount of binding energy keeping them bound. Thus, the incident light needed to have more energy than the binding energy in order to free the electrons.
According to classical wave theory, a wave’s energy depends on its intensity (which depends on its amplitude), not its frequency. Therefore, if the photoelectric effect were to be explained in terms of classical wave theory, changing the intensity of the incident light should have determined whether electrons could be ejected, not the frequency. Therefore, a pure classical wave theory explanation of the photoelectric effect was not possible. Scientists did note, however, that the intensity of the light did affect something—the number of electrons ejected in a given time period. In 1905, Albert Einstein was able to resolve the paradox.
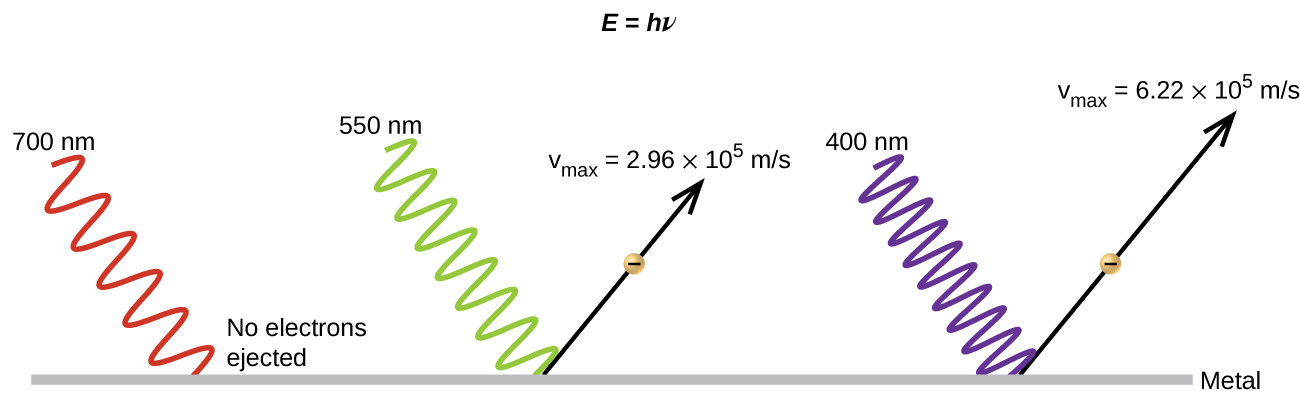
Einstein argued that the light striking the metal surface should not be viewed as a wave (as in the view of classical wave theory), but instead as a stream of particles (later called photons) whose energy depends on their frequency according to the equation, E = hν (where h is a fundamental physical constant known as Planck’s constant, 6.626 × 10⁻³⁴ J·s). Another common form of this equation is in terms of wavelength using c = νλ, E =  (the E in these equations is the energy for a single photon). Einstein explained that electrons were ejected when hit by photons having sufficient energy (a frequency greater than the threshold). The greater the frequency of the incident photon (and thus the greater the energy of the photon), the greater the kinetic energy imparted to the escaping electrons. Einstein argued that, if we think of light consisting of photons, then the intensity of light depends on the number of photons striking the surface times the energy per photon, as opposed to the amplitude of the incoming wave. This explains why the number of ejected electrons increased with increasing intensity of incident light, since the greater the number of incoming photons, the greater the likelihood that they would collide with some of the electrons.
Einstein postulated that each metal has a particular electrostatic attraction for its electrons that must be overcome before an electron can be emitted from its surface. This value is called the binding energy (EBE). If photons of light with energy less than EBE strike a metal surface, no single photon has enough energy to eject an electron, so no electrons are emitted regardless of the intensity of the light. This is an important observation since it showed that the energy of the photons was quantized, or had discrete amounts of energy, and could not be added together to eject a single electron. One photon could eject, at most, one electron. If a photon with energy greater than EBE strikes the metal, then part of its energy is used to overcome the forces that hold the electron to the metal surface, and the excess energy appears as the kinetic energy (EKE) of the ejected electron:
Ephoton = EBE + EKE
Recall from physics (and from the previous module) that EKE = ½mv2, where m in this case is the mass of the electron (9.11 × 10⁻³¹ kg) and v is the velocity of the electron (in m/s).
Because the photoelectric effect could not be described using wavelike properties, it suggested a particle-like nature of light where the energy of the electromagnetic radiation depends on the frequency (or wavelength) of light, not the intensity of the light. This was the first time that scientists had encountered something that exhibited both wave-like and particle properties. Sometimes it was better to treat electromagnetic radiation as a wave and sometimes as a stream of photons, two seemingly contradictory pictures of reality which independently could not fully explain the phenomena of light, but together they could. It took many years for the scientific community to accept the wave/particle nature of light, and even today the full meaning of wave/particle duality is still debated.

Use this simulation program to experiment with the photoelectric effect to see how intensity, frequency, type of metal, and other factors influence the ejected photons.
Example 1
Photoelectric Effect
Identify which of the following statements are false and, where necessary, change the italicized word or phrase to make them true, consistent with Einstein’s explanation of the photoelectric effect.
- Increasing the brightness (intensity) of incoming light at a fixed frequency increases the kinetic energy of the ejected electrons.
- Increasing the wavelength of incoming light increases the kinetic energy of the ejected electrons.
- Increasing the brightness (intensity) of incoming light increases the number of ejected electrons.
- Increasing the frequency of incoming light can increase the number of ejected electrons.
Solution
- False. Increasing the brightness of incoming light at a fixed frequency has no effect on the kinetic energy of the ejected electrons. Only the frequency of light influences the kinetic energy of the electrons.
- False. Increasing the frequency of incoming light increases the kinetic energy of the ejected electrons. Frequency is proportional to energy and inversely proportional to wavelength. Frequencies above the threshold value transfer the excess energy into the kinetic energy of the electrons.
- True. Because the number of collisions with photons increases with brighter light, the number of ejected electrons increases.
- True with regard to the threshold energy binding the electrons to the metal. Below this threshold, electrons are not emitted and above it they are. Once over the threshold value, further increasing the frequency does not increase the number of ejected electrons. If you carefully explore the PHET demo, you will see that for very high energy photons there are exceptions to this rule. We will not consider these exceptions in this class.
Check Your Learning
Calculate the threshold energy (which is the same as the binding energy) in kJ/mol of electrons in aluminum, given that the lowest frequency photon for which the photoelectric effect is observed is 9.87 × 10¹⁴ Hz.
Answer:
394 kJ/mol
Example 2
Kinetic Energy of an Ejected Electron
Considering the photoelectric effect, if 331 kJ/mol is the electron binding energy for solid potassium, then:
- What minimum amount of energy does a photon need in order to cause a single electron to be emitted?
- If solid potassium is irradiated with 300 nm light, what is the maximum kinetic energy of the emitted electrons?
Solution
(a)  = 5.50 × 10⁻¹⁹ J/e–
(b) We found the binding energy in (a) as 5.50 × 10⁻¹⁹ J/e–. We will use the 300 nm wavelength to determine the energy of the incoming light. The difference between the energy of the photon and the energy needed to remove the electron is the maximum kinetic energy of the electron.
Ephoton = EBinding Energy + EKE of ejected electrons
= 5.50 × 10⁻¹⁹ J/e– + EKE of ejected electrons
 = 5.50 × 10⁻¹⁹ J/e– + EKE of ejected electrons
EKE of ejected electron = 1.12 × 10⁻¹⁹ J/e–
Blackbody Radiation and the Ultraviolet Catastrophe
You have just seen that electromagnetic radiation demonstrates properties of particles called photons. The concept of photons was described by Einstein for the purposes of the photoelectric effect, however, several years earlier (1900) Max Planck, in an effort to describe blackbody radiation, developed mathematical expressions that, in hindsight, suggested the particle properties of light to Einstein. His discovery resolved the apparent contradiction of blackbody radiation, the first phenomenon which caused scientists to recognize the fundamental limitations of classical physics.
A blackbody is a convenient, ideal emitter that approximates the behavior of many materials when heated. A blackbody is “ideal” in the same sense that an ideal gas is a convenient, simple representation of real gases that works well, provided that the pressure is not too high nor the temperature too low. A good approximation of a blackbody that can be used to observe blackbody radiation is a metal oven that can be heated to very high temperatures. The oven has a small hole allowing for the light being emitted within the oven to be observed with a spectrometer, an instrument that can measure the wavelengths and intensities of light. Figure 2 shows the resulting curves for some representative temperatures. Each distribution depends only on a single parameter: the temperature. The wavelength at which the maximum intensity is observed in the blackbody curves, λmax, shift to shorter wavelengths as the temperature increases, reflecting the observation that metals being heated to high temperatures begin to glow a darker red that becomes brighter as the temperature increases, eventually becoming white hot at very high temperatures as the intensities of all of the visible wavelengths become appreciable.
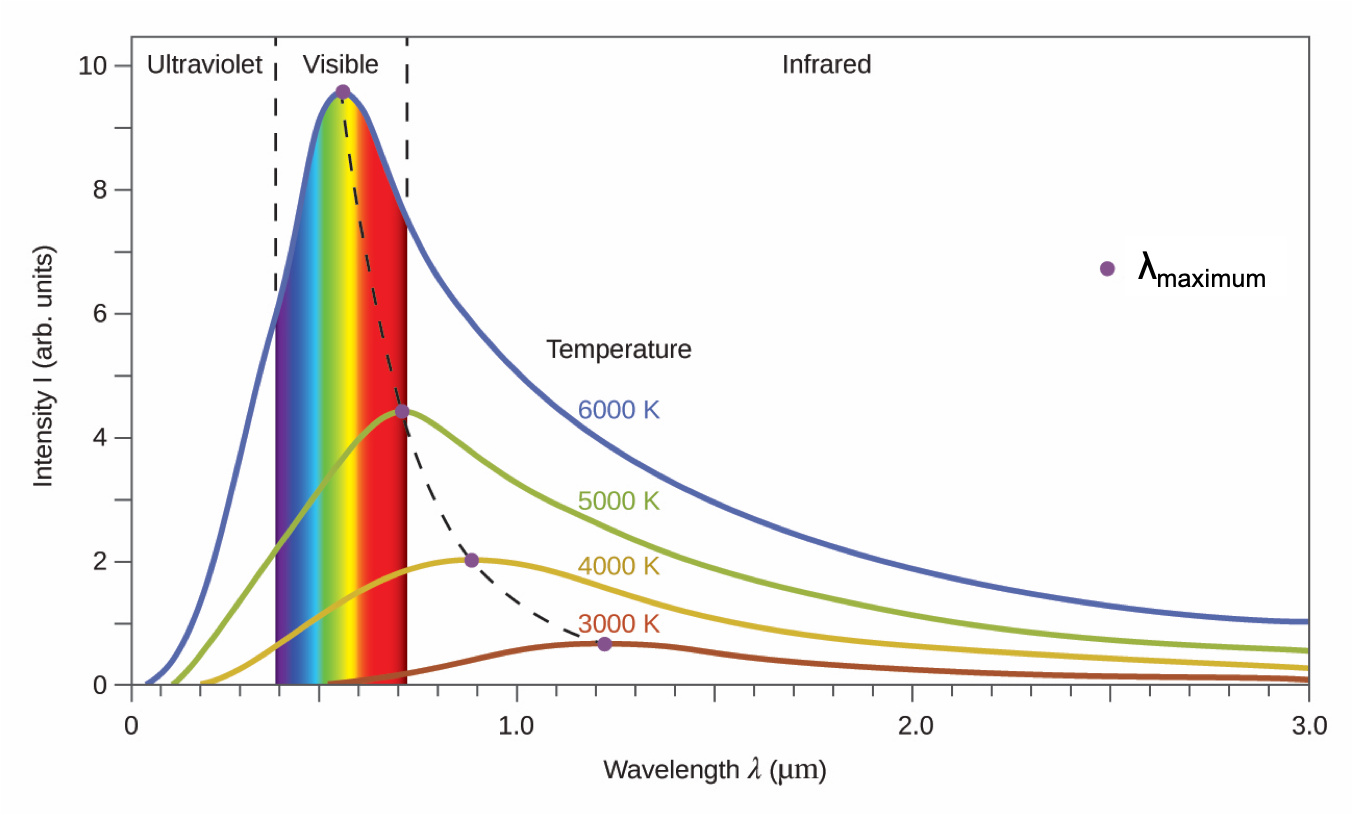
Physicists derived mathematical expressions for the blackbody curves using well-accepted concepts from the theories of classical mechanics and classical electromagnetism. The theoretical expressions as functions of temperature fit the observed experimental blackbody curves well at longer wavelengths, but showed significant discrepancies at shorter wavelengths. Not only did the theoretical curves not show a peak, they absurdly showed the intensity becoming infinitely large as the wavelength became smaller and approached the UV region. This became known as the “ultraviolet catastrophe” because no one could find any problems with the theoretical treatment that could lead to such unrealistic short-wavelength behavior.
Finally, Max Planck derived a theoretical expression for blackbody radiation that fit the experimental observations exactly (within experimental error). Planck developed his theoretical treatment by extending the earlier work that had been based on the premise that the atoms composing the oven vibrated at increasing frequencies (or decreasing wavelengths) as the temperature increased, with these vibrations being the source of the emitted electromagnetic radiation. But where the earlier treatments had allowed the vibrating atoms to have any energy values obtained from a continuous set of energies (perfectly reasonable, according to classical physics), Planck found that by restricting the vibrational energies to discrete values for each frequency, he could derive an expression for blackbody radiation that correctly had the intensity dropping rapidly for the short wavelengths in the UV region: E = hν. We used this equation above to calculate the energy of a photon, but it originated with Planck in his description of blackbody radiation. The quantity h is a constant now known as Planck’s constant, in his honor. Although Planck was pleased he had resolved the blackbody radiation paradox, he was disturbed that to do so, he needed to assume the vibrating atoms required quantized energies, which he was unable to explain. The value of Planck’s constant is very small, 6.626 × 10⁻³⁴ Joule seconds (J·s), which helps explain why energy quantization had not been observed previously in macroscopic phenomena.
Use this simulation program to see how the blackbody radiation of Earth, a lightbulb, the sun and Sirius A compare. Adjust the temperature and see how the wavelength and intensity of the spectrum change.
Example 3
Calculating the Energy of Radiation
When we see light from a neon sign, we are observing radiation from excited neon atoms. If this radiation has a wavelength of 640 nm, what is the energy of the photon being emitted?
Solution
We use the part of Planck’s equation that includes the wavelength, λ, and convert units of nanometers to meters so that the units of λ and c are the same.
E =  = 3.10 × 10⁻¹⁹ J
Check Your Learning
The microwaves in an oven are of a specific frequency that will heat the water molecules contained in food. (This is why most plastics and glass do not become hot in a microwave oven—they do not contain water molecules.) This frequency is about 3 × 10⁹ Hz. What is the energy of one photon in these microwaves? You’ll see a demonstration of how microwaves heat up food in a later module.
Answer:
2 × 10⁻²⁴ J
Key Concepts and Summary
The photoelectric effect and blackbody radiation both required a particle-like quantized view of light, where light existed in discrete packets of energy called photons. The photoelectric effect showed that light with a frequency higher than some threshold frequency could eject an electron from a clean sheet of metal, and once that threshold frequency was reached, a higher intensity of the light allowed more electrons to be ejected. Blackbody radiation was a paradox for classical theories because the theoretical expressions of blackbody radiation did not accurately describe it. The classical theory of electromagnetism, which allowed vibrating atoms to have an energy from a continuous spectrum, was unable to explain the observations of blackbody radiation. In order to more accurately predict the shape of blackbody radiation curves, Planck needed to restrict the energies of the vibrations to discrete values.
Key Equations
- E = hν =
- EKE = ½mv2
- Ephoton = EBinding Energy + EKE of ejected electrons
Glossary
- binding energy
- the energy that must be overcome to eject an electron from the surface of a metal
- photon
- smallest possible packet of electromagnetic radiation, a particle of light
Chemistry End of Section Exercises
- What is the threshold frequency for sodium metal if a photon with frequency 6.66 × 10¹⁴ s−1 ejects an electron with 7.74 × 10⁻²⁰ J kinetic energy? Will the photoelectric effect be observed if sodium is exposed to orange light (λ = 635 nm)?
- Consider the photoelectric effect.
- Determine the energy (in kJ/mol) of light with wavelength 355 nm.
- The binding energy of a certain metal is 242 kJ/mol. Will electrons be ejected if light with wavelength 355 nm strikes the surface of this metal? Explain briefly using the relevant wavelengths.
- In an experiment involving the photoelectric effect, which of the following will cause more electrons to be ejected from the metal surface?
- Increasing the energy of the light.
- Increasing the frequency of the light.
- Increasing the wavelength of the light.
- Increasing the intensity (number of photons) of the light.
- All of the above will cause more electrons to be emitted.
- To eject electrons from the surface of a certain metal requires photons with a wavelength less than or equal to 975 nm.
- To what region of the electromagnetic spectrum does 975 nm correspond?
- infrared region
- yellow part of the visible spectrum
- blue part of the visible spectrum
- ultraviolet region
- X-ray region
- Determine the minimum frequency of light that can eject electrons from this metal’s surface (in Hz).
- Determine the binding energy of an electron at the surface of this metal (in kJ/mol).
- To what region of the electromagnetic spectrum does 975 nm correspond?
Answers to Chemistry End of Section Exercises
- 5.49 × 10¹⁴ s−1; no because the energy of orange light (3.12 × 10⁻¹⁹ J/photon) is less than the binding energy of sodium (3.64 × 10⁻¹⁹ J/e–).
- (a) 337 kJ/mol
(b) An electron will be ejected because the incident light has a wavelength less than the threshold wavelength. - D
- (a) A; (b) 3.08 × 10¹⁴ Hz; (c) 123 kJ/mol
Please use this form to report any inconsistencies, errors, or other things you would like to change about this page. We appreciate your comments. 🙂
