
M17Q2: Microstates and Entropy
Learning Objectives
- Differentiate between and determine the number of macrostates and microstates in a simple system of gas molecules, and explain why there is a higher probability that energy will be dispersed than it will be concentrated in a small number of nanoscale particles.
| Microstates | Entropy | - Determine relative entropies of different substances with respect to their physical state and complexity of the molecule.
| Relative Entropies | - Predict the sign of ΔS of a system for a given chemical or physical process.
| Key Concepts and Summary | Key Equations | Glossary | End of Section Exercises |
Dispersal of Matter and Energy
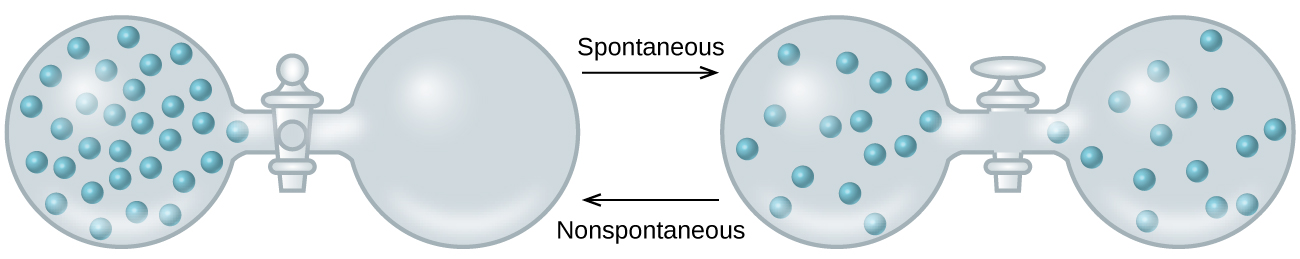
As we extend our discussion of thermodynamic concepts toward the objective of predicting spontaneity, consider now an isolated system consisting of two flasks connected with a closed valve. Initially there is an ideal gas on the left and a vacuum on the right (Figure 1). When the valve is opened, the gas spontaneously expands to fill both flasks.
Recalling the definition of pressure-volume work from the section on thermochemistry, note that no work has been done because the pressure in a vacuum is zero. Since the system is isolated, no heat has been exchanged with the surroundings (q = 0). The first law of thermodynamics confirms that there has been no change in the system’s internal energy as a result of this process.
The spontaneity of this process is therefore not a consequence of any change in energy that accompanies the process. Instead, the driving force appears to be related to the greater, more uniform dispersal of matter that results when the gas is allowed to expand. Initially, the system was comprised of one flask containing matter and another flask containing nothing. After the spontaneous process takes place, the matter distributes both more widely (occupying twice its original volume) and more uniformly (present in equal amounts in each flask).
Now consider two objects at different temperatures: object X at temperature TX and object Y at temperature TY, with TX > TY (Figure 2). When these objects come into contact, heat spontaneously flows from the hotter object (X) to the colder one (Y). This corresponds to a loss of thermal energy by X and a gain of thermal energy by Y. From the perspective of this two-object system, there was no net gain or loss of thermal energy; rather, the available thermal energy was redistributed between the two objects. This spontaneous process resulted in a more uniform dispersal of energy.

As illustrated by the two processes described, an important factor in determining the spontaneity of a process is the extent to which it changes the dispersal or distribution of matter and/or energy. In each case, a spontaneous process took place that resulted in a more uniform distribution of matter or energy.
Example 1
Redistribution of Matter during a Spontaneous Process
Describe how matter is redistributed when the following spontaneous processes take place:
- A solid sublimes.
- A gas condenses.
- A drop of food coloring added to a glass of water forms a solution with uniform color.
Solution
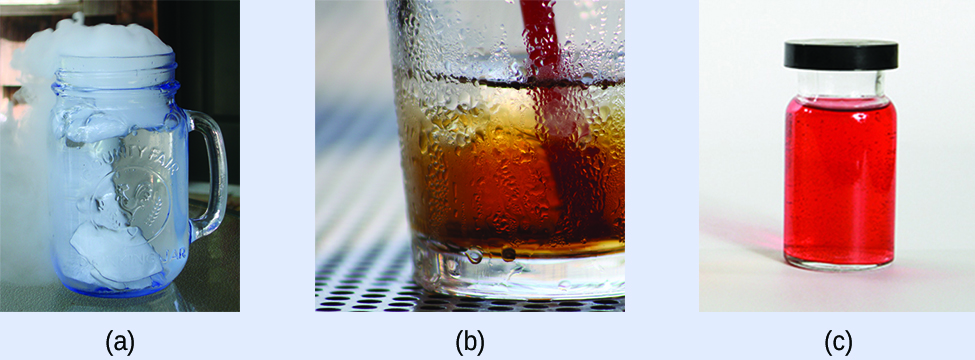
(a) Sublimation is the conversion of a solid (relatively high density) to a gas (much lesser density). This process yields a much greater dispersal of matter, since the molecules will occupy a much greater volume after the solid-to-gas transition.
(b) Condensation is the conversion of a gas (relatively low density) to a liquid (much greater density). This process yields a much lesser dispersal of matter, since the molecules will occupy a much lesser volume after the solid-to-gas transition.
(c) The process in question is dilution. The food dye molecules initially occupy a much smaller volume (the drop of dye solution) than they occupy once the process is complete (in the full glass of water). The process therefore entails a greater dispersal of matter. The process may also yield a more uniform dispersal of matter, since the initial state of the system involves two regions of different dye concentrations (high in the drop, zero in the water), and the final state of the system contains a single dye concentration throughout.
Check Your Learning
Describe how matter and/or energy is redistributed when you empty a canister of compressed air into a room.
Answer:
This is also a dilution process, analogous to example (c). It entails both a greater and more uniform dispersal of matter as the compressed air in the canister is permitted to expand into the lower-pressure air of the room.
Microstates and Pascal’s Triangle
Ludwig Boltzmann developed a molecular-scale statistical model that related the distribution of matter within a system as the number of microstates possible for the system. A microstate (W) is a specified configuration of a system’s particles and their respective locations and energies.
Consider the general case of a system comprised of N particles distributed among n boxes. The number of microstates possible for such a system is nN. For example, distributing four particles among two boxes will result in a total of 24 = 16 different microstates as illustrated in Figure 4. Microstates with equivalent particle arrangements (not considering individual particle identities) are grouped together and are called macrostates. The probability that a system will exist with its components in a given macrostate is the number of microstates within the macrostate divided by the total number of possible microstates.

Although calculating the total number of microstates is straightforward (i.e. 2n fo n particles in a 2-flask system), knowing how many microstates are within a given macrostate can be tedious. However, for a 2-flask system, Pascal’s triangle allows us to calculate the number of microstates much more easily. Pascal’s triangle is a “triangle of 1’s” on the exterior positions of the triangle. In order to calculate the interior numbers, we add the two numbers directly above the number we wish to calculate, as shown by the red arrows in Figure 5.

Let’s take another look at Figure 4 and apply Pascal’s Triangle. A 4-particle system contains 5 macrostates, so we use the 5th row of Pascal’s Triangle, 1 – 4 – 6 – 4 – 1, and apply these values to the number of microstates within each macrostate. For the first macrostate (a), with 4 molecules in the first box and 0 molecules in the second box, there is only one possible microstate to fit that system. For the second macrostate (b), with 3 molecules in the first box and 1 molecule in the second box, there are 4 different ways to arrange 4 individual molecules with each molecule taking a turn alone in the second box.
Entropy
At the molecular level, Entropy (S) is related to the total number of microstates (W).
S= k ln(W)
Here S is the entropy, k is the Boltzmann constant with a value of 1.38 × 10⁻²³ J/K, and W is the number of microstates.
Predicting the Sign of ΔS
The relationships between entropy, microstates, and matter/energy dispersal described previously allow us to make generalizations regarding the relative entropies of substances and to predict the sign of entropy changes for chemical and physical processes. Consider the phase changes illustrated in Figure 6. In the solid phase, the atoms or molecules are restricted to nearly fixed positions with respect to each other and are capable of only modest oscillations about these positions. With essentially fixed locations for the system’s component particles, the number of microstates is relatively small. In the liquid phase, the atoms or molecules are free to move over and around each other, though they remain in relatively close proximity to one another. This increased freedom of motion results in a greater variation in possible particle locations, so the number of microstates is correspondingly greater than for the solid. As a result, Sliquid > Ssolid and the process of converting a substance from solid to liquid (melting) is characterized by an increase in entropy, ΔS > 0. By the same logic, the reciprocal process (freezing) exhibits a decrease in entropy, ΔS < 0.
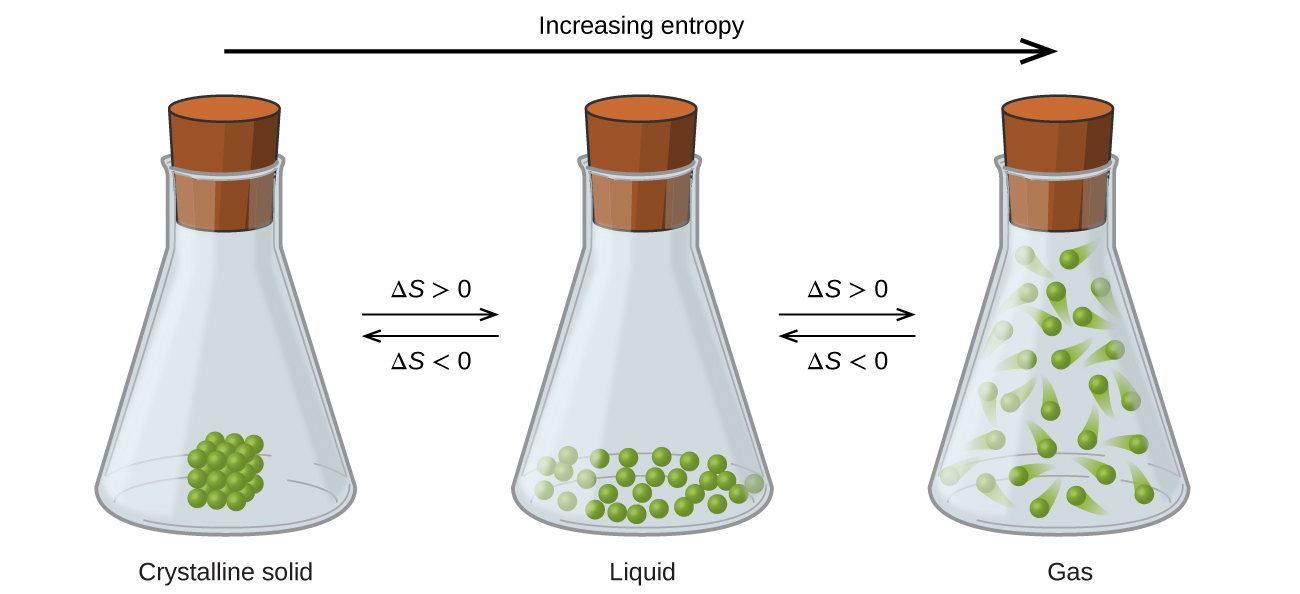
Now consider the vapor or gas phase. The atoms or molecules occupy a much greater volume than in the liquid phase; therefore each atom or molecule can be found in many more locations than in the liquid (or solid) phase. Consequently, for any substance, Sgas > Sliquid > Ssolid, and the processes of vaporization and sublimation likewise involve increases in entropy, ΔS > 0. Likewise, the reciprocal phase transitions, condensation and deposition, involve decreases in entropy, ΔS < 0.
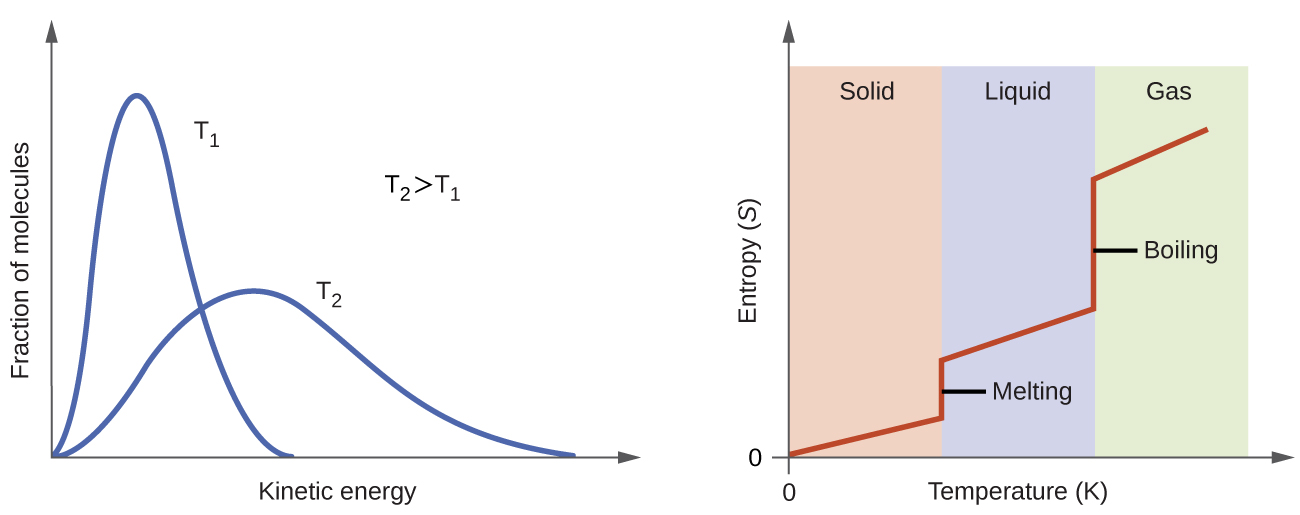
According to kinetic-molecular theory, the temperature of a substance is proportional to the average kinetic energy of its particles. Raising the temperature of a substance will result in more extensive vibrations of the particles in solids and more rapid translations of the particles in liquids and gases. At higher temperatures, the distribution of kinetic energies among the atoms or molecules of the substance is also broader (more dispersed) than at lower temperatures. Thus, the entropy for any substance increases with temperature (Figure 7).

Try this simulator with interactive visualization of the dependence of particle location and freedom of motion on physical state and temperature.
The entropy of a substance is also influenced by structure of the particles (atoms or molecules) that comprise the substance. With regard to atomic substances, heavier atoms possess greater entropy at a given temperature than lighter atoms, which is a consequence of the relationship between a particle’s mass and the spacing of quantized translational energy levels (which is a topic beyond the scope of this course). For molecules, greater numbers of atoms (regardless of their masses) increase the ways in which the molecules can vibrate and thus the number of possible microstates and the system entropy.
Finally, variations in the types of particles affects the entropy of a system. Compared to a pure substance, in which all particles are identical, the entropy of a mixture of two or more different particle types is greater. This is because of the additional orientations and interactions that are possible in a system comprised of nonidentical components. For example, when a solid dissolves in a liquid, the particles of the solid experience both a greater freedom of motion and additional interactions with the solvent particles. This corresponds to a more uniform dispersal of matter and energy and a greater number of microstates. The process of dissolution therefore involves an increase in entropy, ΔS > 0.
Summary of Entropy
- Sgas > Sliquid > Ssolid
- The entropy for any substance increases with temperature.
- Heavier atoms possess greater entropy at a given temperature than lighter atoms.
- For molecules, greater numbers of atoms increase the system entropy.
- The entropy of a mixture of two or more different particle types is greater than that of a pure substance.
Considering the various factors that affect entropy allows us to make informed predictions of the sign of ΔS for various chemical and physical processes as illustrated in Example 2.
Example 2
Predicting the Sign of ∆S
Predict the sign of the entropy change for the following processes. Indicate the reason for each of your predictions.
- One mole liquid water at room temperature ⟶ one mole liquid water at 50 °C
- Ag+(aq) + Cl–(aq) → AgCl(s)
- C6H6(ℓ) +
 O2(g) → 6 CO2(g) + 3 H2O(ℓ)
 - NH3(s) → NH3(ℓ)
Solution
- positive, temperature increases
- negative, reduction in the number of ions (particles) in solution
- negative, net decrease in the amount of gaseous species
- positive, phase transition from solid to liquid, net increase in dispersal of matter
Check Your Learning
Predict the sign of the enthalpy change for the following processes. Give a reason for your prediction.
- NaNO3(s) → Na+(aq) + NO3–(aq)
- the freezing of liquid water
- CO2(s) → CO2(g)
- CaCO3(s) → CaO(s) + CO2(g)
Answer:
- Positive; The solid dissolves to give an increase of mobile ions in solution.
- Negative; The liquid becomes a more ordered solid.
- Positive; The relatively ordered solid becomes a gas.
- Positive; There is a net production of one mole of gas.
Key Concepts and Summary
Entropy is the natural tendency of a system to favor a more uniform dispersal of matter. The more microstates a particular system contains, the greater the entropy of the system. The fewer microstates a particular system contains, the less entropy there is in the system. The applications to chemical systems are summarized here.
Key Equations
- S = k ln(W)
Glossary
- entropy
- related to the total number of microstates and how systems spontaneously disperse energy rather than concentrate energy
- Ludwig Boltzmann
- a scientist that developed a molecular-scale statistical model that related the distribution of matter within a system as the number of microstates possible for the system
- microstate
- a specified configuration of a system’s particles and their respective locations and energies
Chemistry End of Section Exercises
- The following diagram shows all possible distributions and microstates are shown for four different particles shared between two boxes:
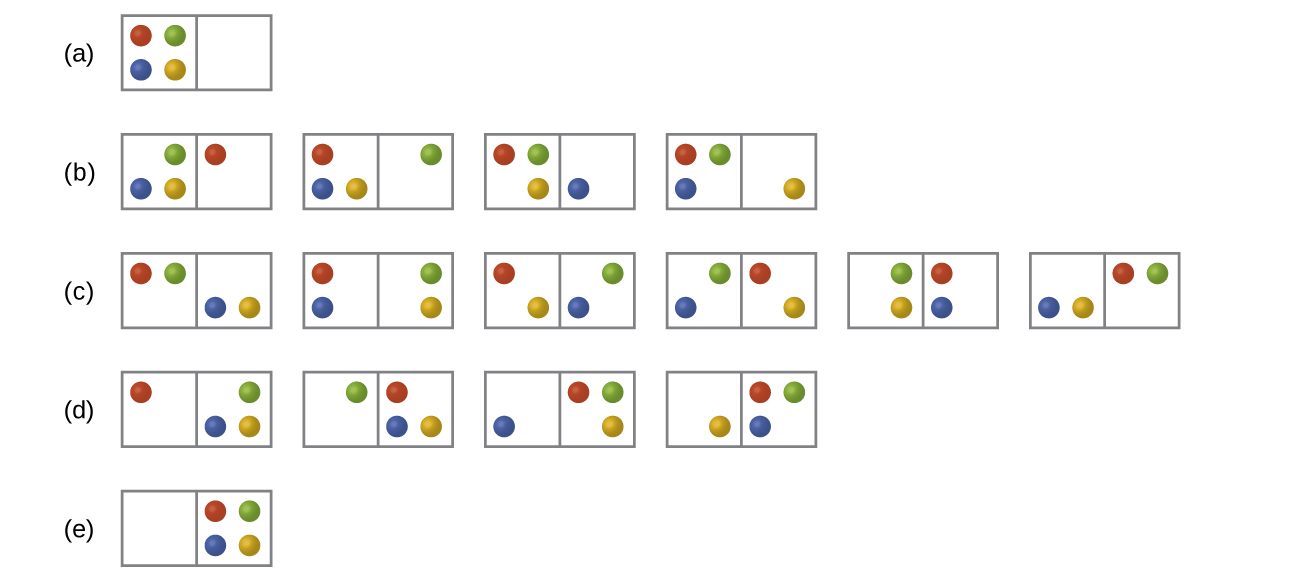
- Will the entropy change, ΔS, be positive, negative or unchanged if the particles are initially all in one chamber, as in distribution row (a), but then are converted to distribution row (c).
- Will the entropy change, ΔS, be positive, negative or unchanged for the system when it is converted from distribution row (b) to distribution row (d).
- Consider a system similar to the one in problem 1, except that it contains six particles instead of four. Compare the probability of having all the particles in only one of the two boxes in the case with the similar probability for the system of four particles that we have derived to be equal to 18. What does this comparison tell us about even larger systems?
- Arrange the following sets of systems in order of increasing entropy. Assume one mole of each substance and the same temperature for each member of a set.
- H2(g), HBrO4(g), HBr(g)
- H2O(ℓ), H2O(g), H2O(s)
- He(g), Cl2(g), P4(g)
- CO(g), CO2(g), CO2(s)
- At room temperature, the entropy of the halogens increases from I2 to Br2 to Cl2. Explain.
- Consider two processes: sublimation of I2(s) and melting of I2(s) (Note: the latter process can occur at the same temperature but somewhat higher pressure). Is ΔS positive or negative in these processes? In which of the processes will the magnitude of the entropy change be greater?
- Predict the sign of the entropy change for the following processes. Give a reason for your prediction.
- Pb2+(aq) + S2-(aq) → PbS(s)
- 4 Fe(s) + 3 O2(g) → 2 Fe2O3(s)
- 2 C6H14(ℓ) + 19 O2(g) → 14 H2O(g) + 12 CO2(g)
- Which of the following will have a positive change in entropy?
- The freezing of liquid water: H2O(ℓ) → H2O(s)
- The oxidation of carbon monoxide: 2 CO(g) + O2(g) → 2 CO2(g)
- The combustion of propane gas: C3H8(g) + 5 O2(g) → 3 CO2(g) + 4 H2O(ℓ)
- Only (i)
- Only (ii)
- Only (iii)
- Only (ii) and (iii)
- None of these will have a positive change in entropy.
- In which state would one mole of argon gas have the highest entropy? Justify your answer in a few sentences.
- At 25°C in a volume of 5 L
- At 25°C in a volume of 10 L
- At 100°C in a volume of 5 L
- At 100°C in a volume of 10 L
- Argon has the same entropy in all four of these states.
- In which of the following reactions will the entropy decrease? Select all that apply.
- NaCl(s) → Na+(aq) + Cl–(aq)
- N2O4(g) → 2 NO2(g)
- 2 NH3(g) → N2(g) + 3 H2(g)
- CaO(s) + CO2(g) → CaCO3(s)
- 2 C(s) + O2(g) → 2 CO(g)
- For each of the following processes, identify the expected sign for the entropy change.
- SrO(s) + CO2(g) → SrCO3(s)
- A gas expands to double its original volume isothermally
- AgNO3(aq) + HBr(aq) → AgBr(s) + HNO3(aq)
- 2 O3(g) → 3 O2(g)
Answers to Chemistry End of Section Exercises
- (a) There is one initial microstate and six final microstates so the entropy increases.
(b) There are four initial microstates and four final microstates so the entropy remains constant, unchanged. - The probability for all the particles to be on one side (1 out of 32) is much lower than the 1 out of 8 result for the four-particle system. The conclusion we can make is that the probability for all the particles to stay in only one part of the system will decrease rapidly as the number of particles increases, and, for instance, the probability for all molecules of gas to gather in only one side of a room at room temperature and pressure is negligible since the number of gas molecules in the room is very large.
- (a) H2(g) < HBr(g) < HBrO4(g)
(b) H2O(s) < H2O(ℓ) < H2O(g)
(c) He(g) < Cl2(g) < P4(g)
(d) CO2(s) < CO(g) < CO2(g) - The masses of these molecules would suggest the opposite trend in their entropies. The observed trend is a result of the more significant variation of entropy with a physical state. At room temperature, I2 is a solid, Br2 is a liquid, and Cl2 is a gas.
- When sublimating, I2 changes phase from solid to gas, resulting in a positive entropy change. When melting, I2 changes phase from solid to liquid, also a positive entropy change, although smaller than the sublimation entropy change.
- (a) Negative. The relatively ordered solid precipitating decreases the number of mobile ions in solution.
(b) Negative. There is a net loss of three moles of gas from reactants to products.
(c) Positive. There is a net increase of seven moles of gas from reactants to products. - E
- D. Increasing the temperature of a gas increases the kinetic energy of the gas molecules and increases the entropy. Similarly, as gases expand to fill the container they occupy, increasing the volume of a container also increases the entropy of a gas.
- D
- (a) ΔS < 0; (b) ΔS > 0; (c) ΔS < 0; (d) ΔS > 0
Please use this form to report any inconsistencies, errors, or other things you would like to change about this page. We appreciate your comments. 🙂
