
M16Q5: Interpretation of Titration Curves
Learning Objectives
- Classify acid-base titration curves as any of the following titration combinations: strong acid/strong base, weak acid/strong base, weak base/strong acid.
| Strong Acid/Strong Base | Weak Acid/Strong Base |
| Weak Base/Strong Acid | Polyprotic |
| Key Concepts and Summary | Glossary | End of Section Exercises |
In the last section, we saw a couple of different titration curves, titrating a strong base with either a weak or a strong acid. We learned that the pH at the equivalence point is important for knowing what is reacting in solution, but there were also some other similarities or differences in the curves. In this section, we are going to learn how to interpret titration curves and use them to predict what is reacting in solution.
Strong Acid/Strong Base Titration Curves
Strong acid/strong base titrations both use the same chemical equation to describe what is happening during the titration:
H3O+(aq) + OH–(aq) → 2 H2O(ℓ)
Figure 1 (below) shows a strong acid being titrated with a strong base. At the beginning of the reaction, only the strong acid is present, resulting in a pH < 7. As the reaction proceeds, some of the acid reacts with the added base to produce water, resulting in a lower [H3O+] and a higher pH, although the pH is still less than 7. At around 20 mL, the pH sharply increases at the equivalence point, where the moles of acid are equal to the moles of added base. The pH at the equivalence point is equal to 7.00, since only water is present at this point. After the equivalence point, all of the acid has been used up and the pH is reflective of the excess base present.
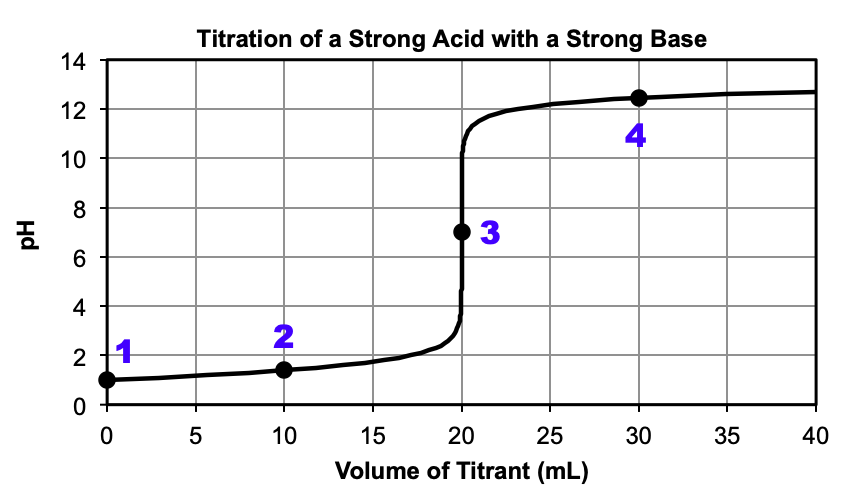
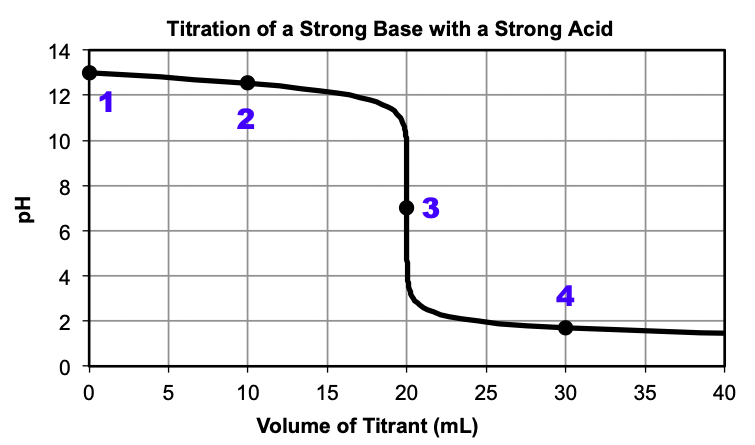
Figure 2 shows the opposite titration, where a strong base is titrated with a strong acid. Once again, at the beginning of the reaction, only the strong base is present, resulting in a pH > 7. As the reaction proceeds, some of the base reacts with the added acid to produce water, resulting in lower [OH–] and a lower pH, although the pH is still greater than 7. At around 20 mL, the pH sharply decreases at the equivalence point, where the moles of base are equal to the moles of added acid. The pH at the equivalence point is equal to 7.00, since only water is present at this point. After the equivalence point, all of the base has been used up and the pH is reflective of the excess acid present.
Weak Acid/Strong Base Titration Curves
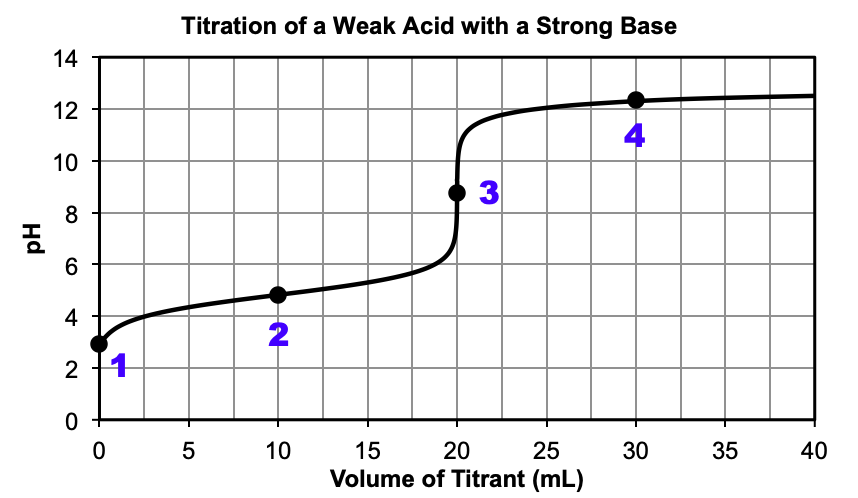
Weak acid/strong base titrations are similar to strong acid/strong base titrations, but typically involve an extra step or two. When we add a weak acid to a strong base, we get the reaction:
HA(aq) + OH–(aq) ⇌ H2O(ℓ) + A–(aq)
Figure 3 shows a weak acid being titrated with a strong base. At the beginning of the reaction, only the weak acid is present, resulting in a pH < 7. As the reaction proceeds, some of the weak acid reacts with the added strong base to produce water and the conjugate base. Between the beginning of the titration and the equivalence point, the added strong base is the limiting reactant and after the reaction, the weak acid and its conjugate base make a buffer solution. At around 20 mL, the pH sharply increases at the equivalence point, where the moles of weak acid are equal to the moles of added strong base. The pH at the equivalence point is greater than 7.00, since only water and the conjugate base are present at this point. After the equivalence point, all of the weak acid has been used up and the conjugate base and excess strong base remain. The pH can be calculated by the excess strong base alone, since the effect of the weak base on the [OH–] is minimal. Compare the titration curves of Figure 1 and Figure 3 after the equivalence point – see how similar they are?
Weak Base/Strong Acid Titration Curves
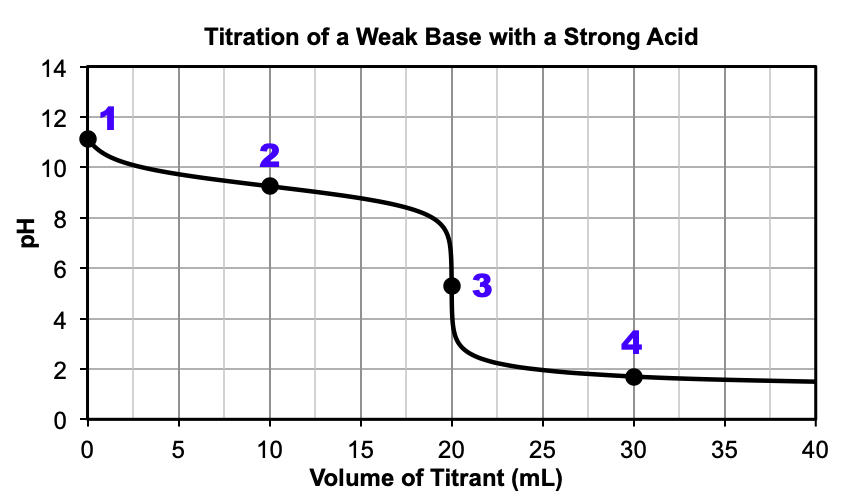
Weak base/strong acid titrations are similar to weak acid/strong base titrations. When we add a weak base to a strong acid, we get the reaction:
A–(aq) + H3O+(aq) ⇌ H2O(ℓ) + HA(aq)
Figure 4 shows a weak base being titrated with a strong acid. At the beginning of the reaction, only the weak base is present, resulting in a pH > 7. As the reaction proceeds, some of the weak base reacts with the added strong acid to produce water and the conjugate acid. Between the beginning of the titration and the equivalence point, the added strong acid is the limiting reactant and after the reaction, the weak base and its conjugate acid make a buffer solution. At around 20 mL, the pH sharply decreases at the equivalence point, where the moles of weak base are equal to the moles of added strong acid. The pH at the equivalence point is less than 7.00, since only water and the conjugate acid are present at this point. After the equivalence point, all of the weak base has been used up and the conjugate acid and excess strong acid remain. The pH can be calculated by the excess strong acid alone, since the effect of the weak acid on the [H3O+] is minimal. Compare the titration curves of Figure 2 and Figure 4 after the equivalence point – see how similar they are?
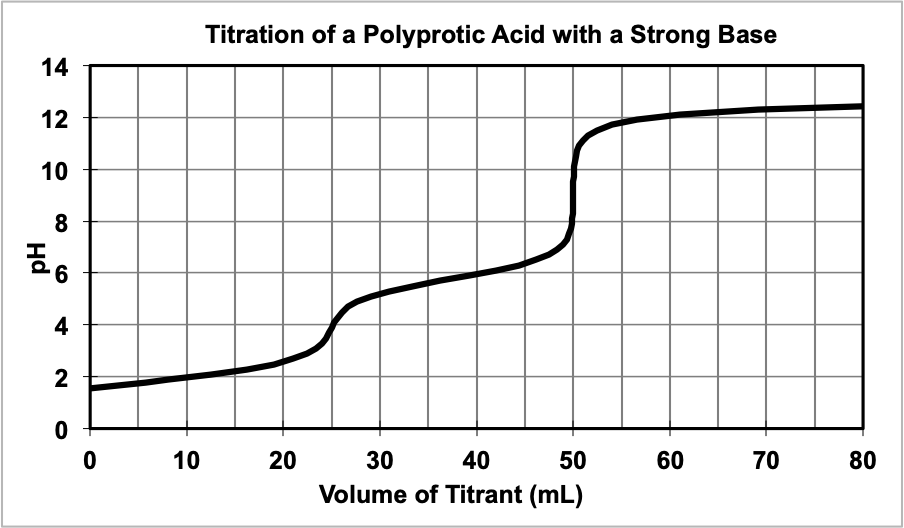
Polyprotic Acid/Base Titration Curves
Polyprotic Acid/Base titrations are essentially multiple weak acid/strong base titrations put together and are only discussed briefly in this course. Figure 5 shows a weak polyprotic acid being titrated with a strong base. Notice how they are two equivalence points – this means that the polyprotic acid we start with must have two acidic hydrogens to start with, like H2A (i.e. H2CO3, etc).
Key Concepts and Summary
Titration curves provide even more information than what is needed to find the concentration of the analyte. Two key markers in a titration curve help us identify whether the analyte and titrant in a titration is a strong or weak, acid or base. The first marker is if the initial pH is above or below 7. If the pH is above 7, the analyte is either a weak or strong base. If the pH is below 7, the analyte is either a weak or strong acid. The second marker is the pH at the equivalence point. If the pH is equal to 7, the titration involves both a strong acid and strong base. If the pH is above 7, the titration is between a weak acid and strong base. If the pH is below 7, the titration is between a weak base and strong acid.
Glossary
- half equivalence point (or midpoint)
- the pH when half of the volume of titrant has been added. In a weak/strong titration, this is the point where the pH = pKa of the weak acid in the flask.
Chemistry End of Section Exercises
- Refer to the titration curve graph below, where 20.0 mL samples of multiple NaOH solutions are titrated with 0.040 M HCl, in order to determine if the following statements are true or false. Explain your answer briefly.
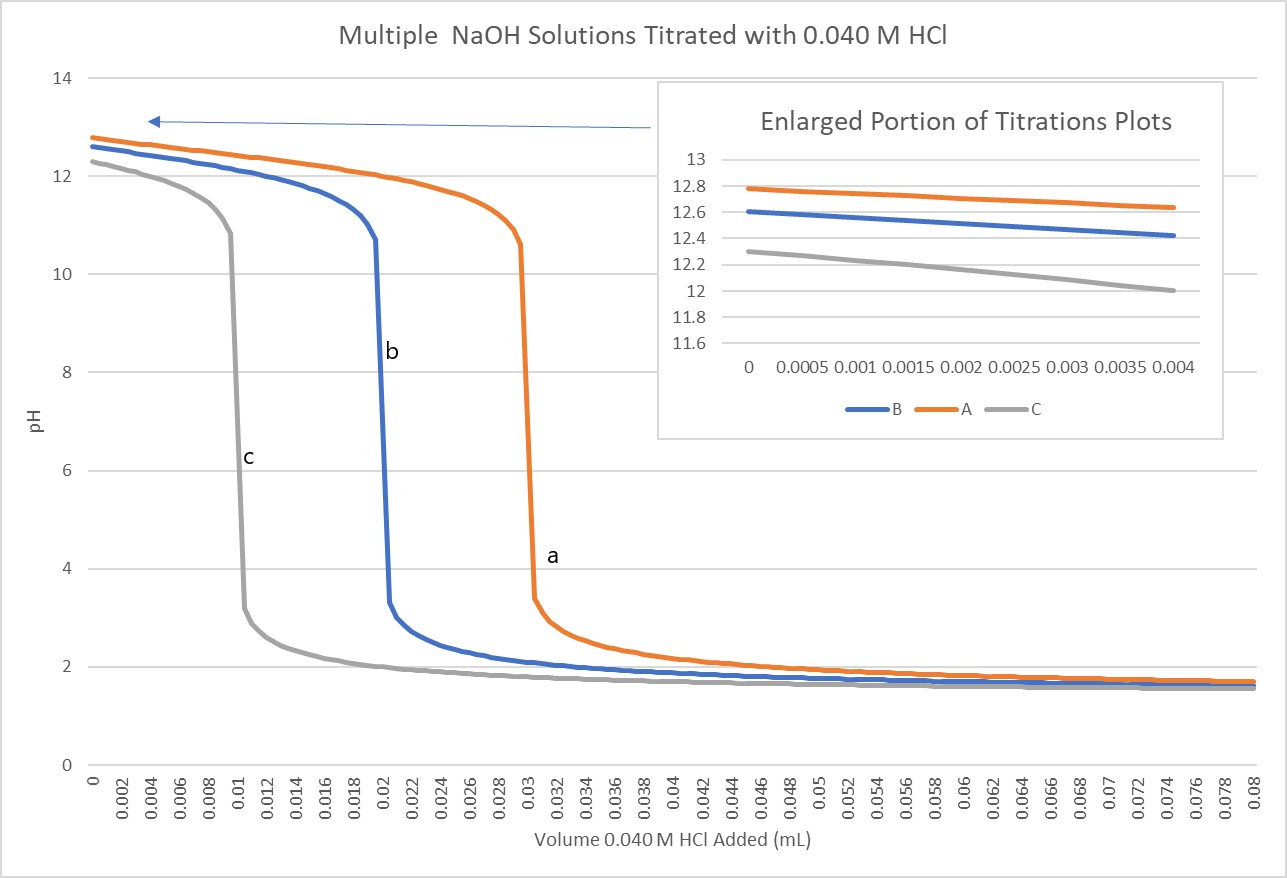
- The pH of the equivalence point is greater for titration a than titration b.
- The concentration of NaOH in titration c is greater that of the NaOH in titration b.
- Titration c has the most concentrated acid.
- The samples of NaOH all have the same concentrations, but different starting volumes.
- For which type of titration will the pH be basic at the equivalence point?
- A strong acid titrated with a strong base.
- A weak base titrated with a strong acid.
- A weak acid titrated with a strong base.
- A strong base titrated with a strong acid.
- None of the above.
- Which acid-base titration could yield a titration curve like that shown below?
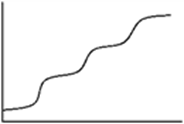
- H2CO3 being titrated with NaOH
- Na3PO4 being titrated with HCl
- NaOH being titrated with H3PO4
- H2SO4 being titrated with NaOH
- H3PO4 being titrated with NaOH
- A 25.0 mL aliquot of 0.100 M NH3 is titrated with 0.150 M HCl. After 10.0 mL of HCl has been added, which of the following statements is correct?
- The solution is basic and more titrant must be added to reach the equivalence point.
- The solution is basic and excess titrant has been added beyond the equivalence volume.
- The solution is acidic and more titrant must be added to reach the equivalence point.
- The solution is acidic and excess titrant has been added beyond the equivalence volume.
- The solution is neutral and the titration is at the equivalence point.
- Consider the following titration curve.
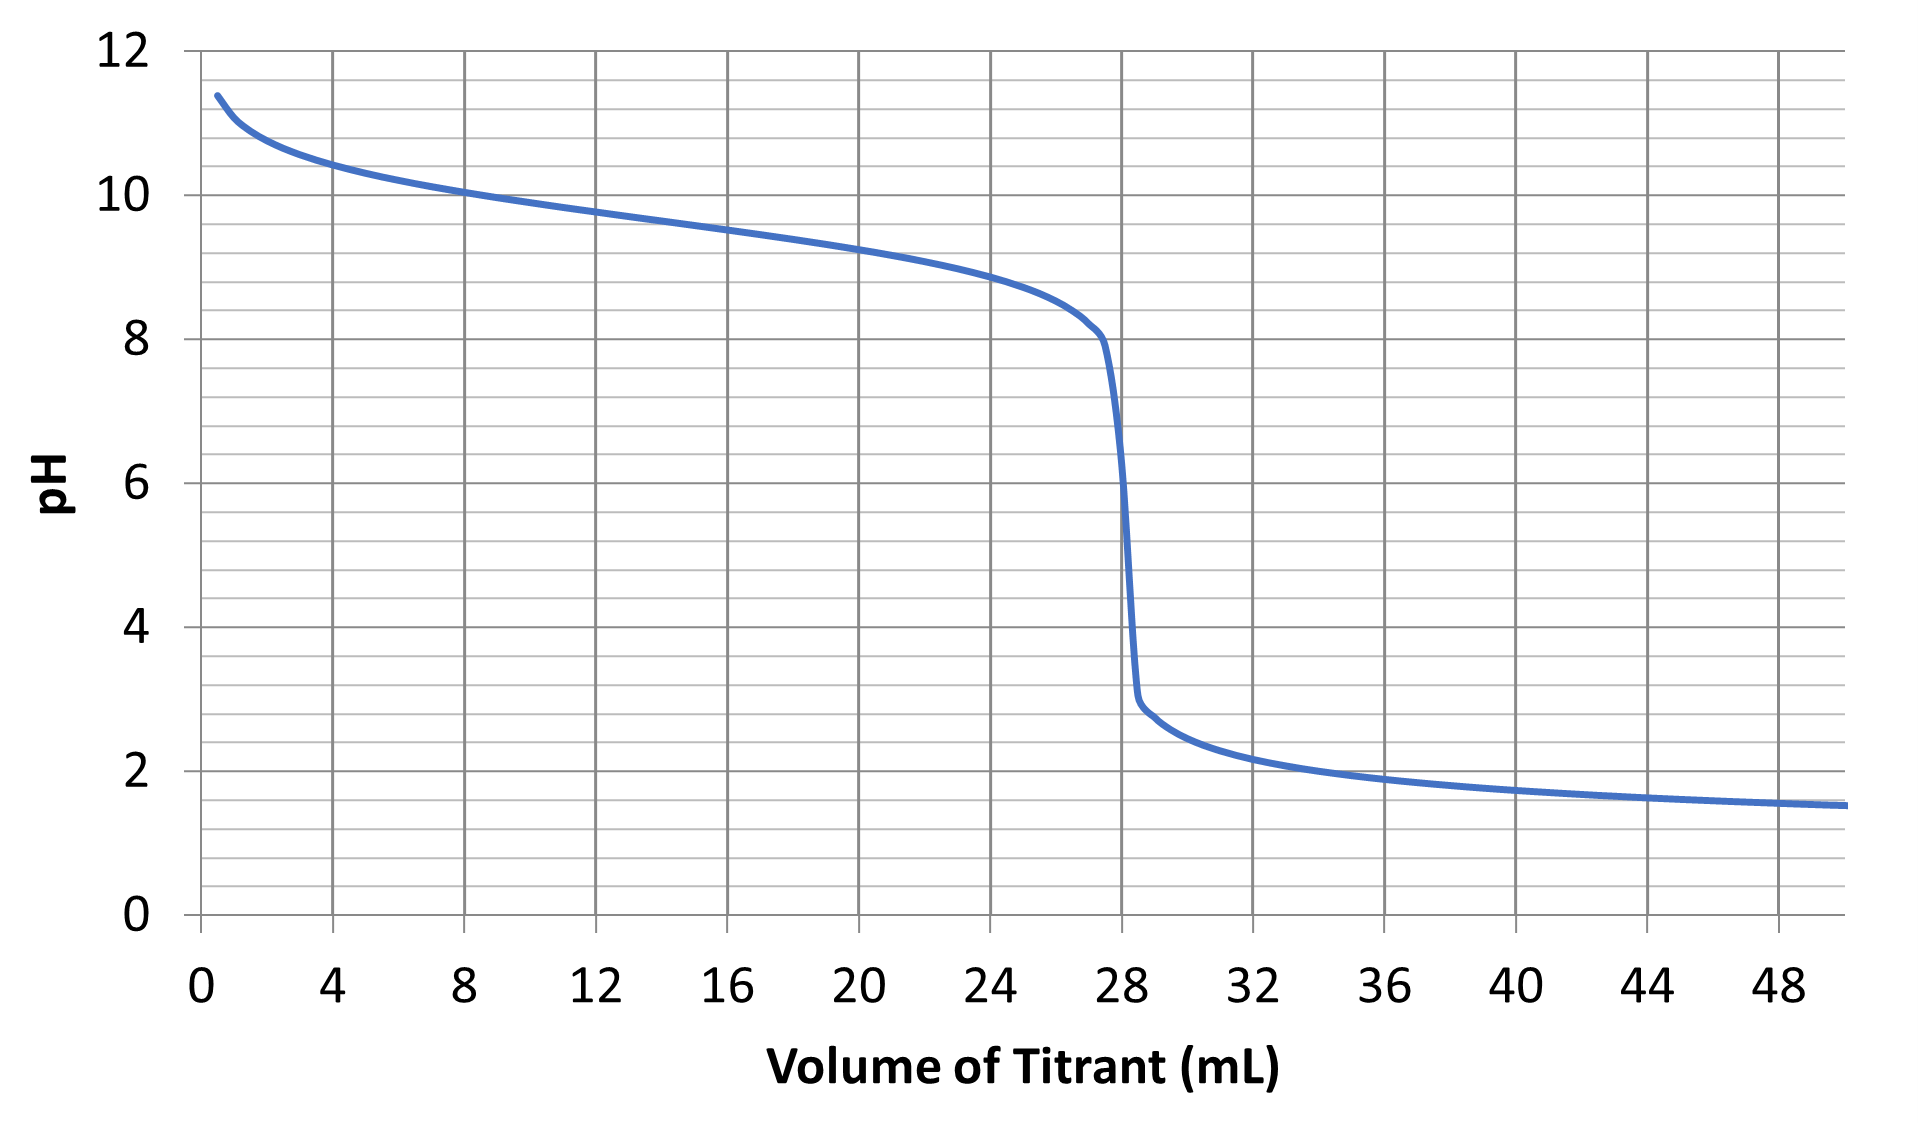
- What is the volume of titrant and the pH at the equivalence point?
- Is the analyte an acid or a base? Is it weak or strong? Is it monoprotic or polyprotic? Justify your answers.
- What is the value of pKb for the analyte solution?
- Write a generic net ionic equation using “HA” for any weak acid, “A–” for any weak base, “H3O+” for any strong acid, and “OH–” for any strong base for the reaction that occurs as titrant is added to analyte. In that reaction equation, underline the acid or base with the highest concentration at Vtitrant = 28 mL.
- A list of common indicators and the pH ranges over which they change colors is provided below. Which indicator would be best for determining the equivalence point of this reaction?
- Methyl red (red at pH = 4.5, yellow at pH = 6)
- Methyl orange (red at pH = 3.0, yellow at pH = 4.5)
- Methyl violet (yellow at pH = 0, violet at pH = 1.5)
- Thymol blue (red at pH = 1, yellow from pH = 2.8 to pH = 8, blue at pH = 9.5 and higher)
- Phenolphthalein (colorless at pH = 8.2, pink at pH = 10)
Answers to Chemistry End of Section Exercises
- (a) False; all of the titrations have an equivalence point of pH = 7 so they are all represent a strong base titrated by a strong acid.
(b) False; the equivalence point occurs when the moles acid added equals the moles base originally found in the analyte. It took fewer mL of acid to reach the equivalence point of titration c so there were fewer original base moles, and hence a lower concentratration.
(c) False; the acid has the same concentration in each titration.
(d) False; the enlarged portion of the graph shows that each titration began at a different pH, indicating that each had a different initial concentration. - C
- E
- A
- (a) Volume = 28 mL, pH = 5.6
(b) The analyte is a weak monoprotic base. You can tell the analyte is a base because the initial pH is greater than 7. You can tell that the base is monoprotic because there is only one equivalence point. You can tell that the base is a weak base because the equivalence point occurs at pH less than 7.
(c) The pKa of the conjugate weak acid is 9.6. Therefore, pKb = 4.4
(d) A–(aq) + H3O+(aq) ⇌ HA(aq) + H2O(ℓ)
(e) A
Please use this form to report any inconsistencies, errors, or other things you would like to change about this page. We appreciate your comments. 🙂
