
M5Q5: Gas Behavior, Kinetic Molecular Theory, and Temperature
Introduction
Although the gas laws describe relationships that have been verified by many experiments, they do not tell us why gases follow these relationships. This section explores the behavior of ideal gases along with the kinetic molecular theory (KMT) of gases. The kinetic molecular theory will explain these relationships as well as the behavior of ideal gases at the sub-microscopic level. This section includes worked problems, examples, and a glossary.
Learning Objectives for Gas Behavior, Kinetic Molecular Theory, and Temperature
- Explain the tenets of Kinetic Molecular Theory and the microscopic relationship between temperature and kinetic energy.
| Kinetic Molecular Theory of Gases | Molecular Velocities and Kinetic Energy | Diffusion of Gases | Kinetic Molecular Theory Practice Problems | Diffusion Practice Problems |
| Key Concepts and Summary | Key Equations | Glossary | End of Section Exercises |
Kinetic Molecular Theory of Gases
Kinetic molecular theory (KMT) is a simple microscopic model that effectively explains the gas laws described in previous section of this module. This theory is based on the following postulates, which you have seen before in our definition of an ideal gas:
- Gases consist of tiny particles that move at different speeds and in every possible direction; they are in constant motion.
- The size of gas particles is much smaller than the distances between them. Most of the volume of a gas is empty space.
- There is no force of attraction or repulsion between gas particles. This is because the molecules are so far apart from each other.
- They undergo billiard-ball-like collisions (elastic collisions) with the walls of the container and with each other.
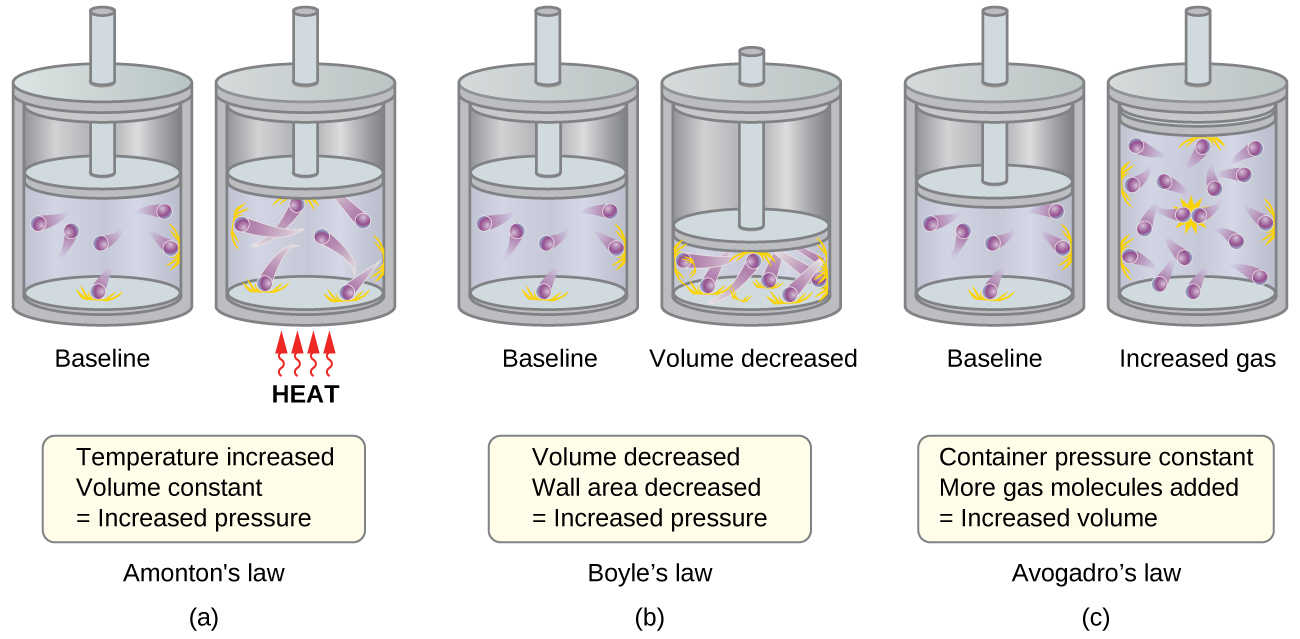
The various gas laws can be derived from the assumptions of the KMT. We will first look at the individual gas laws conceptually to see how KMT explains them. Recalling that gas pressure is exerted by rapidly moving gas molecules and depends directly on the number of molecules hitting a unit area of the wall per unit of time, we see that the KMT conceptually explains the behavior of a gas as follows and in Figure 1:
- Figure 1a: Relationship between Pressure and Temperature (Amonton or Gay-Lussac’s Law, P ∝ T; when V, n are constant)
If the temperature is increased, the average speed and kinetic energy of the gas molecules increase. If the volume is held constant, the increased speed of the gas molecules results in more frequent and more forceful collisions with the walls of the container, therefore increasing the pressure. - Relationship between Volume and Temperature (Charles’s Law, V ∝ T; when P, n are constant)
If the temperature of a gas is increased, a constant pressure may be maintained only if the volume occupied by the gas increases. This will result in greater average distances traveled by the molecules to reach the container walls. One example is a cylinder like that shown in Figure 1 with a piston that moves to increase the volume. These conditions will decrease the frequency of molecule-wall collisions. - Figure 1b: Relationship between Volume and Pressure (Boyle’s Law, P ∝ 1/V; when T, n are constant)
If the gas volume is decreased, the distance to the container walls decreases, and the frequency of collisions with the wall increases, thereby increasing the pressure. - Figure 1c: Relation between Volume and Mole Number (Avogadro’s Law, V ∝ n; when T, P are constant)
At the atomic scale, each particle gets a certain volume at fixed pressure and temperature. The more molecules, the more volume. - Relation between Pressure and Number of Different Molecules (Dalton’s Law, Ptotal = P1 + P2 + P3 …)
Because of the large distances between them, the molecules of one gas in a mixture bombard the container walls with the same frequency whether other gases are present or not, and the total pressure of a gas mixture equals the sum of the (partial) pressures of the individual gases.
Molecular Velocities and Kinetic Energy
When we insert a thermometer into a gas sample, it will read a single temperature. In reality, though, this is a measure of the average kinetic energy of the entire sample of gas molecules. Some particles will have a kinetic energy (and therefore speed, which we will discuss later) that is close to this average value. However, most particles will have a kinetic energy significantly greater or significantly less than this average value. The energy of particle motion is called kinetic energy (KE). The value of this energy averaged over all of the gas molecules in the sample is labeled as KE. For any gas, the temperature (T) and amount of gas (n, moles) determines the sample’s kinetic energy: KE
KE =  RT, where R = 8.314
Notice that the identity (or molar mass) of the gas is not part of this relationship. Thus, the same amount of any ideal gas at the same temperature will have the same KE. We’ll examine later in this section how the distribution of the particle speeds, however, varies depending on the identity of the gas. At the same temperature, heavier gas will move more slowly (on average) than lighter gases. For simplicity, we’ll start by examining the distribution of particle speeds for one gas at one temperature.
Note that the three dimensional nature of the speed distribution is taken into account in using KE = RT. Particles in three-dimensions have speeds in the x, y, and z directions, thus the 3 × ½.
In a gas sample, individual molecules have widely varying speeds. However, because of the large number of molecules and large number of collisions involved, the molecular speed distribution and average speed are constant at a given temperature for that gas sample. This molecular speed distribution is known as a Maxwell-Boltzmann distribution, and it depicts the relative number of molecules in a bulk sample of gas that possesses a given speed (Figure 2).
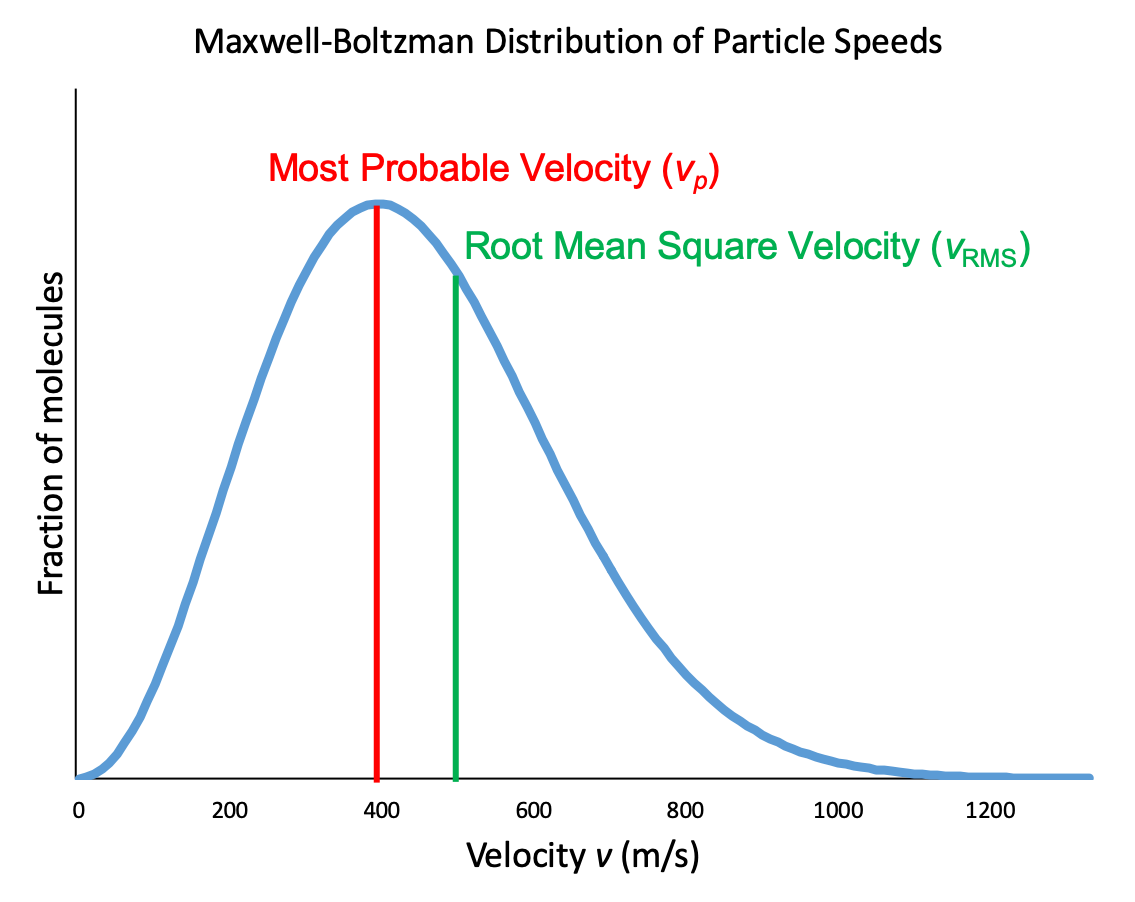
Let’s examine the graph in more detail. The speed of an individual gas particle is on the x-axis. Slow particles are on the left; fast particles are on the right. The relative number of particles possessing a given speed is on the y-axis. Any given point on the line is a measure of the quantity of particles possessing that speed. The most probable velocity (vp) is the speed at the peak of the curve; this is the speed of the largest number of particles. The Maxwell-Boltzmann distribution shows that in a collection of gas particles, a wide range of speeds exist. Some particles will have a speed that is close to this average value. However, most particles will have speeds significantly greater and significantly less than this average value. Also, notice that the curve is not symmetrical. There is a longer tail at the higher speeds than at the lower speeds. Particles cannot have speed less than zero, but a small number of particles can have extremely high speeds.
Another characteristic speed of molecules in Figure 2 is the root mean square velocity of a particle, vrms. It is easy to calculate from our relationship between kinetic energy and temperature from above, which we will now derive.
The kinetic energy (KE) of a single particle with mass (m, in kg) and speed (v, in m/s) is given by:
KE = ½mv2
Expressing mass in kilograms and speed in meters per second will yield energy values in units of joules (J = kg m2 s–2). To deal with a large number of gas molecules, we use averages for both speed and kinetic energy. In the KMT, the root mean square velocity of a particle is defined as the square root of the average of the squares of the velocities and n, the number of particles (in moles):
vrms = 
The average kinetic energy, KE, of 1 mole of particles with molar mass (Μ, in kg/mol) and average speed ( , in m/s) is given by:
KE =  Μ
Μ = RT
= RT
Using these equations and solving for  gives:
Μ = RT

Taking square root of gives:
 =
=  =
= 
where R is the gas constant, T is the kelvin temperature, and M is the mass in kg/mol. When used in this equation, the appropriate form of the gas constant is 8.314 (8.314  ).
).
Now you can see where “root mean square” comes from: it is the square root of the average (mean) value of the square of the velocity. It is a useful quantity because it is so easy to calculate and because it sits about in the middle of the Maxwell-Boltzmann distribution. You should know the relation between KE and T and the expression for vrms without having to look at your notes.
Demonstration: Speed of Br2(g) in air vs. a vacuum
Set up. In this demonstration, we will observe the speed of Br2(g) diffusing. To begin, Br2(l) is contained in a capsule. In the first part of the experiment, the capsule will be broken open in a tube that contains air, the liquid will evaporate, and the brown Br2(g) will begin to move. In the second part of the experiment, the Br2(l) capsule will be broken in a tube containing no air (i.e., a vacuum).
Prediction. Before watching the demonstration, predict whether the bromine will diffuse faster in the tube that contains air or the tube that contains no air.
Explanation. This demonstration shows that the diffusion of Br2(g) in air is significantly slower than the spreading out of Br2(g) into a vacuum. As shown above, the speed of a gas depends only on the temperature and molecular weight. In this demonstration, the temperature is constant and the molecular weight is constant (since both scenarios use Br2). Furthermore, this cannot be explained simply by the Maxwell-Boltzman distribution of particle speeds, because this distribution is present in both samples. The only difference between the scenarios is the presence of the air molecules in the first part. While the air molecules do not change the speed of the Br2 gas, they do introduce an obstacle. Br2 undergoes many collisions with the surrounding air molecules and therefore it is not able to make as much progress even if the molecules are moving at the same speed as in the second part. Imagine running through a crowded hallway vs. running through a completely empty hallway. Even if you are moving at the same speed in both scenarios, you will have to navigate many more collisions and obstacles in the crowded hallway and it will take you longer to reach the other end.
Example 1
Calculation of vrms
Calculate the root-mean-square velocity for a nitrogen molecule at 30 °C.
Solution
Convert the temperature into Kelvin:
30 °C + 273 = 303 K
Determine the mass of a nitrogen molecule in kilograms:
![\dfrac{28.0\;\rule[0.3ex]{0.8em}{0.1ex}\hspace{-0.65em}\text{g}}{1 \;\text{mol}} \times \dfrac{1\;\text{kg}}{1000\;\rule[0.3ex]{0.8em}{0.1ex}\hspace{-0.65em}\text{g}}](https://wisc.pb.unizin.org/app/uploads/quicklatex/quicklatex.com-492426ed86c4db35dfa1a229a7882327_l3.png "Rendered by QuickLaTeX.com") = 0.028 kg/mol
= 0.028 kg/mol
Replace the variables and constants in the root-mean-square velocity equation, replacing Joules with the equivalent kg m2 s–2:
 = 520 m/s
Try converting your answer into miles per hour and see what you get. Molecules move at high speeds!
Check Your Learning
Calculate the root-mean-square velocity for an oxygen molecule at –23 °C.
Answer:
441 m/s
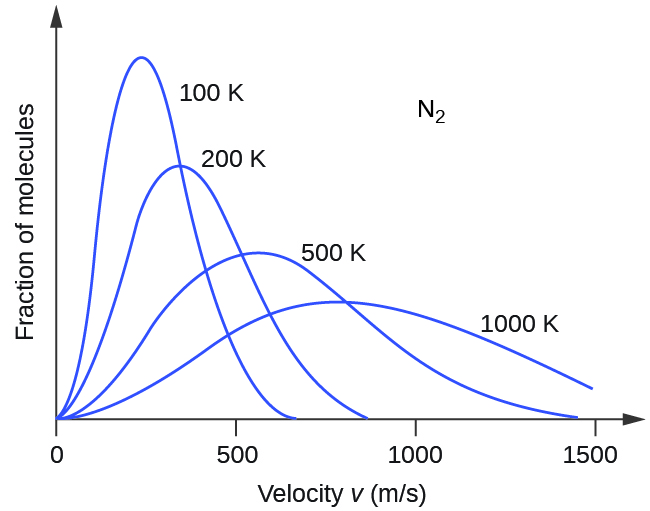
Next, we will consider the distribution of gas speeds in two types of scenarios: either one type of gas at different temperatures or different gases at the same temperature. If the temperature of a gas increases, its KE increases, and more molecules have higher speeds and fewer molecules have lower speeds. Thus, the distribution shifts toward higher speeds overall; that is, to the right. If temperature decreases, KE decreases, and more molecules have lower speeds and fewer molecules have higher speeds. Thus, the distribution shifts toward lower speeds overall; that is, to the left. Notice also that the curve flattens and spreads out as temperature increases. This behavior is illustrated for nitrogen gas in Figure 3.
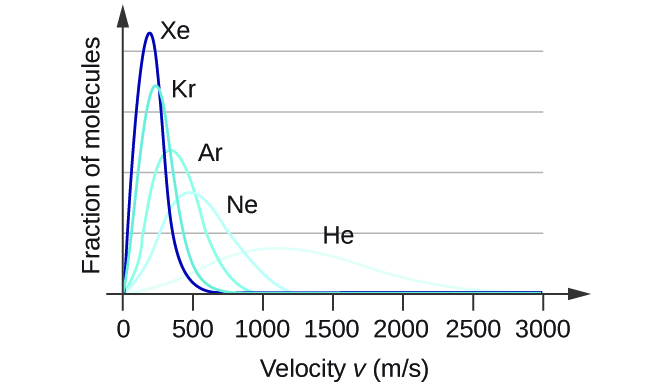
At a given temperature, all molecules have the same average kinetic energy. The relation = teaches us that lighter molecules will have higher speeds on average and heavier molecules will have lower speeds on average. In fact, the entire speed distribution shifts to higher or lower speeds just as you expect, as shown in Figure 4. Again, notice also that curve flattens and spreads out as the molar mass of the gas decreases.
Demonstration: Molecular velocity is inversely related to molecular mass
Set up. In the following demonstration, a long glass tube is set up with bulbs at both ends. The bulb on the left side contains HCl(aq) and the bulb on the right side contains NH4OH(aq), the source of NH3(g). Over time, HCl(g) and NH3(g) evaporate from their respective solutions and when the two gases meet in the tube, they react. Before watching the video, write the balanced chemical reaction that you expect to observe.
Prediction. Based on what you learned above, make a prediction about whether the reaction will take place in the middle of the tube, more to the left, or more to the right.
Explanation. The reaction observed in this demonstration is:
HCl(g) + NH3(g) → NH4Cl(s)
As the reaction occurs, we see the formation of a white solid, the NH4Cl salt. We first see the appearance of the white solid to the left of center. As time progresses, the white starts drifting to the right. To explain this observation, consider the molecular weight of the two reactants. The molecular weight of the HCl is 36.5 g/mol and the molecular weight of NH3 is 17.0 g/mol. The NH3 traveled at a higher velocity down the tube than the HCl. Therefore, at the time that the gases met, the NH3 had traveled further than the HCl and thus began reacting to the left of center. As time continued to progress, the HCl continued to travel down the tube and we see the white product form to the right of the initial meeting spot.
Example 2
What is the kinetic energy of one mole of argon atoms at 25 °C?
Solution
Convert the temperature into Kelvin:
25 °C + 273 = 298 K
Find kinetic energy:
KE = RT = × 8.314  × 1 mol × 298 K = 3.7 × 10³ J = 3.7 kJ
Remember this number! It will become important when we compare it to the strengths of chemical bonds.
Check Your Learning
What is the kinetic energy of one mole of N2 at 25 °C? or of CO2? Or H2O?
Answer:
3.7 kJ
Even though the speed distribution of gases varies with the identity of the gas, the kinetic energy of one mole of any gas at 25 °C is the same!

The gas simulator may be used to examine the effect of temperature on molecular velocities. Examine the simulator’s “energy histograms” (molecular speed distributions) and “species information” (which gives average speed values) for molecules of different masses at various temperatures.
Diffusion of Gases
In the previous section, we discussed the motions of molecules in a gas. Here’s a brief review before we consider rates of diffusion in light of the root mean square velocity of gases.
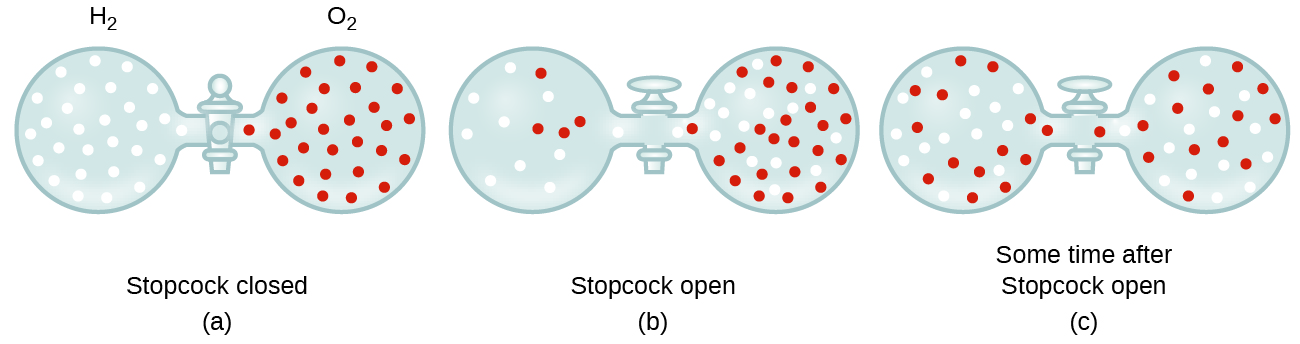
Gaseous molecules travel at tremendous speeds (hundreds of meters per second). In general, we know that when a gas sample is introduced to one part of a closed container, its molecules very quickly disperse throughout the container. This process by which molecules disperse in space in response to differences in concentration is called diffusion (shown in Figure 5). In a closed environment, diffusion will ultimately result in equal concentrations of gas molecules throughout, as depicted in Figure 5. The gaseous atoms and molecules continue to move, but since their concentrations are the same in both bulbs, the rates of transfer between the bulbs are equal (no net transfer of molecules occurs).
In 1832, Thomas Graham studied the rates of diffusion of different gases and formulated Graham’s law: The rate of diffusion of a gas is inversely proportional to the square root of the mass of its particles.
rate of diffusion ∝ 
Another way to state Graham’s law is in terms of the root mean square velocity, vrms:
diffusion rate ∝ vrms
From earlier in this section,
vrms =

This relationship assumes that two gases—A and B—are at the same temperature and pressure. The following examples illustrate how to apply Graham’s law and root mean square velocity to solve interesting problems. For example, if we know the identities of gas A and B, then we can determine the ratio of their diffusion rates. Similarly, if we know the ratio of their diffusion rates and the identity of gas A, then we can calculate the molar mass of gas B to identify an unknown gas.
Example 3
Applying Graham’s law to Rates of Diffusion
Calculate the ratio of the rate of diffusion of hydrogen to the rate of diffusion of oxygen.
Solution
Using molar masses:
![\dfrac{\text{rate of diffusion of hydrogen}}{\text{rate of diffusion of oxygen}} = \dfrac{\sqrt{32\;\rule[0.5ex]{3em}{0.1ex}\hspace{-3em}\text{g mol}^{-1}}}{\sqrt{2 \;\rule[0.5ex]{3em}{0.1ex}\hspace{-3em}\text{g mol}^{-1}}} = \sqrt{\dfrac{32}{2}} = \sqrt{16} = 4](https://wisc.pb.unizin.org/app/uploads/quicklatex/quicklatex.com-bcee221ca7129c1091a7baeff891a640_l3.png "Rendered by QuickLaTeX.com")
Hydrogen diffuses four times as rapidly as oxygen.
Check Your Learning
At a particular pressure and temperature, nitrogen gas diffuses at the rate of 79 mL/s. Using the same apparatus at the same temperature and pressure, at what rate will sulfur dioxide diffuse (in mL/s)?
Answer:
52 mL/s
Here is one more example showing how to calculate molar mass from diffusion rate data.
Example 4
Determining Molar Mass Using Graham’s Law
An unknown gas diffuses 1.66 times more rapidly than CO2. What is the molar mass of the unknown gas? What is the identity of the unknown gas? Possible choices include NO2, NH3, CH4, and HCl.
Solution
From Graham’s law, we have:

Plug in known data:

Solve:
Μunknown =  = 16.0 g/mol
The unknown gas is CH4, a gas with this molar mass.
Check Your Learning
Hydrogen gas passes through a porous container 8.97-times faster than an unknown gas. Estimate the molar mass of the unknown gas.
Answer:
161 g/mol
Chemistry in Real Life: Use of Diffusion for Nuclear Energy Applications: Uranium Enrichment
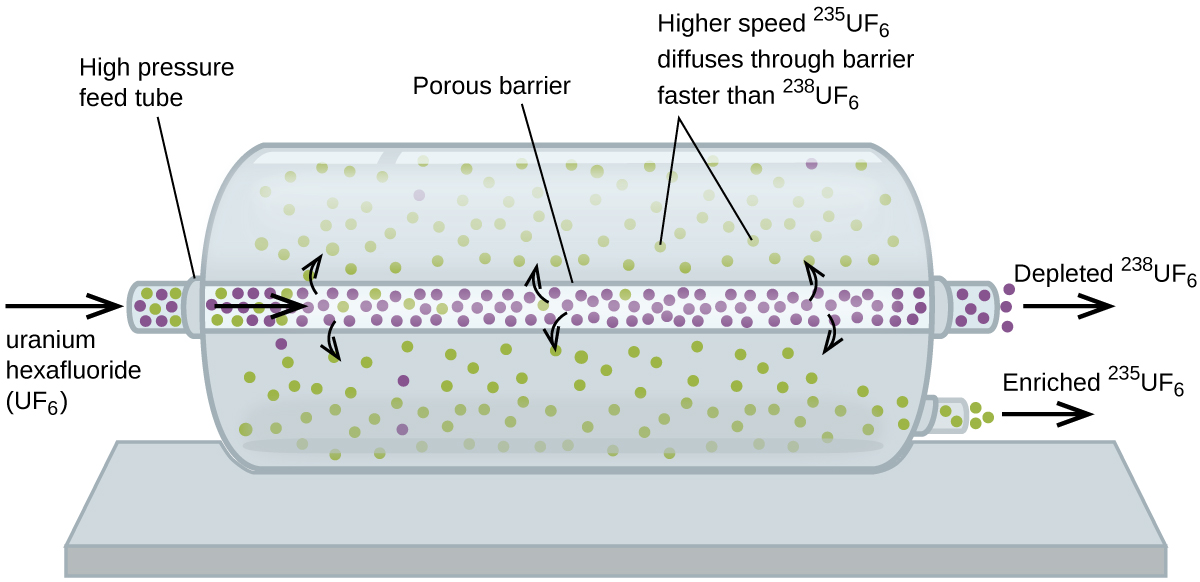
Gaseous diffusion has been used to produce enriched uranium for use in nuclear power plants and weapons. Naturally occurring uranium contains only 0.72% of 235U, the kind of uranium that is fissile, capable of sustaining a nuclear fission chain reaction. Nuclear reactors require fuel that is 2–5% 235U, and nuclear bombs need even higher concentrations. One way to enrich uranium to the desired levels is to take advantage of Graham’s law. In a gaseous diffusion enrichment plant, uranium hexafluoride (UF6, the only uranium compound that is volatile enough to work) is slowly pumped through large cylindrical vessels called diffusers, which contain porous barriers with microscopic openings. The process is one of diffusion because the other side of the barrier is not evacuated. The 235UF6 molecules have a higher average speed and diffuse through the barrier a little faster than the heavier 238UF6 molecules. The gas that has passed through the barrier is slightly enriched in 235UF6 and the residual gas (238UF6) are slightly depleted. The small difference in molecular weights between 235UF6 and 238UF6 causes only about 0.4% enrichment in one diffuser (Figure 6). But by connecting many diffusers in a sequence of stages (called a cascade), the desired level of enrichment can be attained.
The large scale separation of gaseous 235UF6 from 238UF6 was first done during the World War II, at the atomic energy installation in Oak Ridge, Tennessee, as part of the Manhattan Project (the development of the first atomic bomb). Although the theory is simple, this required overcoming many daunting technical challenges to make it work in practice. The barrier must have tiny, uniform holes (about 10–6 cm in diameter) and be porous enough to produce high flow rates. All materials (the barrier, tubing, surface coatings, lubricants, and gaskets) need to be able to contain, but not react with, the highly reactive and corrosive UF6.
Because gaseous diffusion plants require very large amounts of energy (to compress the gas to the high pressures required and drive it through the diffuser cascade, to remove the heat produced during compression, and so on), it is now being replaced by gas centrifuge technology, which requires far less energy.
Key Concepts and Summary
The kinetic molecular theory is a simple but very effective model that explains ideal gas behavior. The theory assumes that gases consist of widely separated molecules of negligible volume that are in constant motion, colliding elastically with one another and the walls of their container with average velocities determined by their absolute temperatures. The individual molecules of a gas exhibit a range of velocities, the distribution of these velocities being dependent on the temperature of the gas and the mass of its molecules.
Key Equations
- KE = RT
where R = 8.314 = 8.314 
- =
where Μ is molar mass in kg/mol 
Glossary
- diffusion
- movement of an atom or molecule from a region of relatively high concentration to one of relatively low concentration (discussed in this chapter with regard to gaseous species, but applicable to species in any phase)
- Graham’s law
- rates of diffusion of gases are inversely proportional to the square roots of their molecular masses
- kinetic molecular theory
- theory based on simple principles and assumptions that effectively explains the behavior of ideal gases
- rate of diffusion
- amount of gas diffusing through a given area over a given time
- root mean square velocity (Vrms)
- measure of average velocity for a group of particles calculated as the square root of the average squared velocity
Chemistry End of Section Exercises
Kinetic Molecular Theory
- Using the postulates of the kinetic molecular theory, explain why a gas uniformly fills a container of any shape.
- Can the average speed of molecules in a constant volume of gas double at constant temperature? Explain your answer.
- Describe what happens to the average kinetic energy of ideal gas molecules when the conditions are changed as follows:
- The pressure of the gas is increased by reducing the volume at constant temperature.
- The pressure of the gas is increased by increasing the temperature at constant volume.
- The average velocity of the molecules is increased by a factor of 2.
- The distribution of molecular velocities in a sample of helium is shown in Figure 4. If the sample is cooled, will the distribution of velocities look more like that of H2 or of H2O? Explain your answer.
- What is the ratio of the average kinetic energy of a SO2 molecule to that of an O2 molecule in a mixture of two gases? What is the ratio of the root mean square speeds, vrms, of the two gases?
- A 1-L sample of CO initially at STP is heated to 546 °C, and its volume is increased to 2 L.
- What effect do the changes have (increase or decrease) on the frequency of collisions of molecules per unit area with the wall?
- What is the effect on the average kinetic energy of the molecules?
- What is the effect on the root mean square speed of the molecules?
- The root mean square speed of H2 molecules at 25 °C is about 1.6 km/s. What is the root mean square speed of a N2 molecule at 25 °C?
- Answer the following questions:
- Is the pressure of the gas in the hot air balloon shown at the opening of this chapter greater than, less than, or equal to that of the atmosphere outside the balloon?
- Is the density of the gas in the hot air balloon shown at the opening of this chapter greater than, less than, or equal to that of the atmosphere outside the balloon?
- At a pressure of 1 atm and a temperature of 20 °C, dry air has a density of 1.2256 g/L. What is the (average) molar mass of dry air?
- The average temperature of the gas in a hot air balloon is 1.30 × 10² °F. Calculate its density, assuming the molar mass equals that of dry air.
- The lifting capacity of a hot air balloon is equal to the difference in the mass of the cool air displaced by the balloon and the mass of the gas in the balloon. What is the difference in the mass of 1.00 L of the cool air in part (c) and the hot air in part (d)?
- An average hot air balloon has a diameter of 60 feet and a volume of 1.1 × 105 ft3. How much mass can the balloon lift? If the weight of the balloon and its rigging is 500 pounds, what is its capacity for carrying passengers and cargo?
- A balloon flight can last about 90 minutes. If all of the fuel is burned during this time, what is the approximate rate of heat loss (in kJ/min) from the hot air in the bag during the flight?
- Oxygen naturally occurs as diatomic molecules, O2, and the triatomic ozone gas, O3. Consider two separate 1.0 mole samples of each gas at STP.
- Which gas will occupy the largest volume?
- In which sample will the molecules be moving the slowest on average?
- In which sample will the molecules hit the sides of the container most frequently?
- Which sample has the highest total kinetic energy?
- You have 1.50 mol samples of H2, CO2, and H2O gases, each in separate containers at STP. Rank them in terms of increasing velocity.
- You have 1.50 mol samples of H2, CO2, and H2O gases, each in separate containers at STP. Rank them in terms of increasing average kinetic energy.
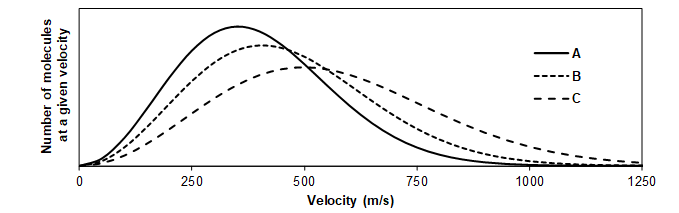
- The same number of moles of NO, Ne, and Ar gas are each contained in separate, sealed, 10.0 liter vessels at 298 K. The graph below shows the speed distribution plots for the three gases. Which line represents the speed distribution of Ne molecules?
Diffusion
- Show that the ratio of the rate of diffusion of Gas 1 to the rate of diffusion of Gas 2,
 , is the same at 0 °C and 100 °C.
 - A balloon filled with helium gas is found to take 6 hours to deflate to 50% of its original volume. How long will it take for an identical balloon filled with the same volume of hydrogen gas (instead of helium) to decrease its volume by 50%?
- Heavy water, D2O (molar mass = 20.03 g/mol), can be separated from ordinary water, H2O (molar mass = 18.01 g/mol), as a result of the difference in the relative rates of diffusion of the molecules in the gas phase. Calculate the relative rates of diffusion of H2O and D2O.
- Calculate the relative rate of diffusion of H2 (molar mass = 2.0 g/mol) compared to that of He (molar mass = 4.0 g/mol) and the relative rate of diffusion of O2 (molar mass = 32 g/mol) compared to that of O3 (molar mass = 48 g/mol).
- A gas of unknown identity diffuses at a rate of 83.3 mL/s in a diffusion apparatus in which carbon dioxide diffuses at the rate of 102 mL/s. Calculate the molecular mass of the unknown gas.
- When two cotton plugs, one moistened with ammonia and the other with hydrochloric acid, are simultaneously inserted into opposite ends of a glass tube that is 87.0 cm long, a white ring of NH4Cl forms where gaseous NH3 and gaseous HCl first come into contact. At approximately what distance from the ammonia moistened plug does this occur? (Hint: Calculate the rates of diffusion for both NH3 and HCl, and find out how much faster NH3 diffuses than HCl.) NH3(g) + HCl(g) → NH4Cl(s)
- Certain chemicals have a characteristic odors and are used for flavoring candy. Wintergreen (C8H8O3) smells minty due to vaporized form of the compound traveling through the air, while ethyl acetate (C4H8O2) smells fruity.
- You are standing in a room and a friend is standing on the opposite side of the room. Your friend holds two capped vials, one with wintergreen and one with ethyl acetate. When she opens the cap on the two vials at the same time, you predict that: (Assume equal amounts of molecules go into the gas phase when the vial is opened.)
- Both odors will reach you at the same time.
- The fruity smell (ethyl acetate) will reach you first.
- The minty smell (wintergreen) will reach you first.
- You chose the answer above because:
- Both particles are traveling at the same velocity and have the same kinetic energy.
- The fruity-smelling molecule (ethyl acetate) has the greater kinetic energy.
- The minty-smelling molecule (wintergreen) has the greater kinetic energy.
- The fruity-smelling molecule (ethyl acetate) has the greater velocity.
- The minty-smelling molecule (wintergreen) has the greater velocity.
- You are standing in a room and a friend is standing on the opposite side of the room. Your friend holds two capped vials, one with wintergreen and one with ethyl acetate. When she opens the cap on the two vials at the same time, you predict that: (Assume equal amounts of molecules go into the gas phase when the vial is opened.)
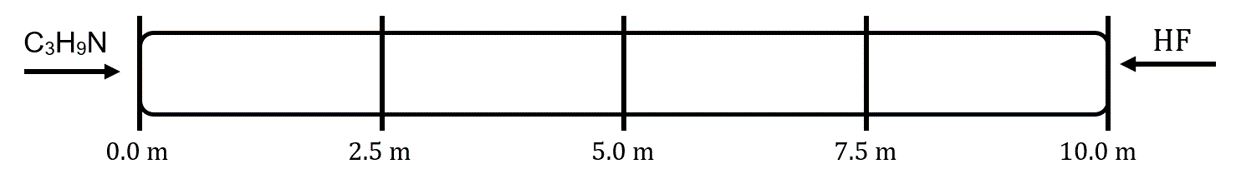
- Trimethylamine (C3H9N, MW = 59.11 g/mol) and hydrogen fluoride (MW = 20.01 g/mol) are released at opposite ends of a 10.0 m long tube. When they mix, they form solid trimethylammonium fluoride:
C3H9N(g) + HF(g) → C3H9NHF(s)
- Assume that under these conditions, the trimethylamine diffuses at a rate of 1.0 m/s. What is the diffusion rate of the hydrogen fluoride under these conditions?
- Indicate the general region in the tube where the solid will begin to form:
Answers to Chemistry End of Section Exercises
- Gases consist of tiny particles that move at different speeds and in every possible direction; they are in constant motion.
- No. At any given instant, there are a range of values of molecular speeds in a sample of gas. Any single molecule can speed up or slow down as it collides with other molecules. However, the average velocity of all the gas molecules stays constant at constant temperature.
- (a) The average kinetic energy remains unchanged.
(b) As T increases, the average kinetic energy increases by the same factor.
(c) The average kinetic energy increases by a factor of 4. - H2O. Cooling slows the velocities of the He atoms, causing them to behave as though they were heavier.
- Average kinetic energy ratio: 1:1. vrms ratio: SO2:O2 = 1:√2
- (a) The frequency of collisions per unit area of the container wall increases.
(b) The average kinetic energy triples.
(c) The root mean squared speed (vrms) increases to √3 times its initial value. - 515 m/s
- (a) equal
(b) less than
(c) 29.48 g mol−1
(d) 1.0966 g L−1
(e) 0.129 g/L
(f) 4.01 × 10⁵ g; net lifting capacity = 384 lb
(g) 39.1 kJ min−1 - (a) They’ll be the same; (b) O3; (c) O2; (d) They’ll be the same
Left-click here to watch Exercise 9 problem solving video.
- CO2 < H2O < H2
- H2O = H2 = CO2
- Line C
- From Graham’s law, we know that the rate of diffusion of a gas is inversely proportional to the square root of the mass of its particles. It is not temperature dependent.
- 4.2 hours
- 1.05
- 1.4; 1.2
- 66.0 g/mol
- 51.7 cm
- (a) B; (b) D
- (a) 1.7 m/s
(b)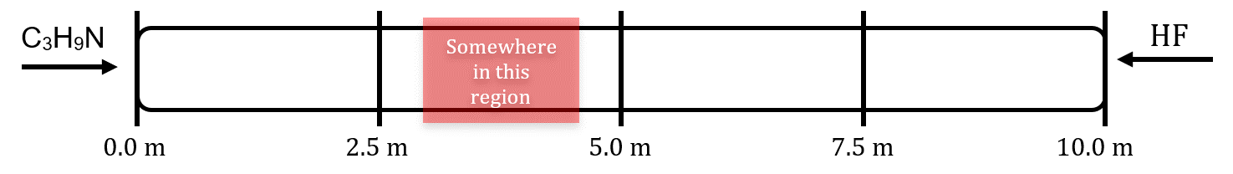
Please use this form to report any inconsistencies, errors, or other things you would like to change about this page. We appreciate your comments. 🙂
