
M2Q3: Isotopes, Atomic Mass, and Mass Spectrometry
Introduction
This section explores isotopes. We’ll examine how we use mass spectrometry to precisely measure the mass and abundance of a given element’s isotopes. The section below provides more detailed description of these topics, worked examples, and practice problems.
Learning Objectives for Isotopes, Atomic Mass, and Mass Spectrometry
- Recognize that elements are identified by the number of protons, but the number of neutrons may vary (isotopes).
| Isotopes | - Calculate natural abundance and atomic mass from mass spectrometry data.
| Natural Abundance | - Sketch a mass spectrometer and explain how one works.
| Mass Spectrometer | - Predict and interpret the information present in the hard and soft mass spectra of a molecular element.
| Mass Spectrometry of Molecules |
| Key Concepts and Summary | Key Equations | Glossary | End of Section Exercises |
Isotopes
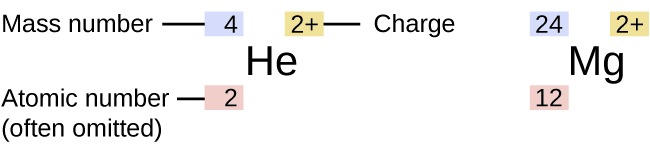
The symbol for a specific isotope of any element is written by placing the mass number as a superscript to the left of the element symbol (Figure 1). The atomic number is sometimes written as a subscript preceding the symbol, but since this number defines the element’s identity, as does its symbol, it is often omitted. For example, magnesium exists as a mixture of three isotopes, each with an atomic number of 12 and with mass numbers of 24, 25, and 26, respectively. These isotopes can be identified as 24Mg, 25Mg, and 26Mg. These isotope symbols are read as “element, mass number” and can be symbolized consistent with this reading. For instance, 24Mg is read as “magnesium 24,” and can be written as “magnesium-24” or “Mg-24.” 25Mg is read as “magnesium 25,” and can be written as “magnesium-25” or “Mg-25.” All magnesium atoms have 12 protons in their nucleus. They differ only because a 24Mg atom has 12 neutrons in its nucleus, a 25Mg atom has 13 neutrons, and a 26Mg has 14 neutrons.
Information about the naturally occurring isotopes of elements with atomic numbers 1 through 10 is given in Table 1. Note that in addition to standard names and symbols, the isotopes of hydrogen are often referred to using common names and accompanying symbols. Hydrogen-2, symbolized 2H, is also called deuterium and sometimes symbolized D. Hydrogen-3, symbolized 3H, is also called tritium and sometimes symbolized T.
| Element | Symbol | Atomic Number | Number of Protons | Number of Neutrons | Mass (amu) | % Natural Abundance |
| hydrogen |  H (protium) H (protium) |
1 | 1 | 0 | 1.0078 | 99.989 |
 H (deuterium) H (deuterium) |
1 | 1 | 1 | 2.0141 | 0.0115 | |
 H (tritium) H (tritium) |
1 | 1 | 2 | 3.01605 | — (trace) | |
| helium |  He He |
2 | 2 | 1 | 3.01603 | 0.00013 |
 He He |
2 | 2 | 2 | 4.0026 | 100 | |
| lithium |  Li Li |
3 | 3 | 3 | 6.0151 | 7.59 |
 Li Li |
3 | 3 | 4 | 7.0160 | 92.41 | |
| beryllium |  Be Be |
4 | 4 | 5 | 9.0122 | 100 |
| boron |  B B |
5 | 5 | 5 | 10.0129 | 19.9 |
 B B |
5 | 5 | 6 | 11.0093 | 80.1 | |
| carbon |  C C |
6 | 6 | 6 | 12.0000 | 98.89 |
 C C |
6 | 6 | 7 | 13.0034 | 1.11 | |
 C C |
6 | 6 | 8 | 14.0032 | — (trace) | |
| nitrogen |  N N |
7 | 7 | 7 | 14.0031 | 99.63 |
 N N |
7 | 7 | 8 | 15.0001 | 0.37 | |
| oxygen |  O O |
8 | 8 | 8 | 15.9949 | 99.757 |
 O O |
8 | 8 | 9 | 16.9991 | 0.038 | |
 O O |
8 | 8 | 10 | 17.9992 | 0.205 | |
| fluorine |  F F |
9 | 9 | 10 | 18.9984 | 100 |
| neon |  Ne Ne |
10 | 10 | 10 | 19.9924 | 90.48 |
 Ne Ne |
10 | 10 | 11 | 20.9938 | 0.27 | |
 Ne Ne |
10 | 10 | 12 | 21.9914 | 9.25 |
Demonstration: Heavy water is more dense than regular water
Set up. As shown in the table above, hydrogen and oxygen each have three isotopes. Of these isotopes, hydrogen-1 and oxygen-16 are by far the most abundant isotopes. Therefore, water molecules typically consist of two hydrogen-1 atoms and one oxygen-16 atom, giving a molecular weight of 18 amu. It is possible to form “heavy water”—water that is composed of two hydrogen-2 atoms and one oxygen-16 atom. This heavy water has a molecular weight of 20 amu. In this demonstration, we compare the density of solid regular water (regular ice) and solid heavy water (“heavy water ice”) by placing each into a glass of liquid regular water.
Prediction. Before watching the video, make a prediction about whether the heavy water ice will float or sink in the glass of liquid water.
Explanation. In this video, the regular ice floats on the liquid regular water, as expected for an ice cube in a glass of water because the density of solid (regular) water is less than the density of liquid (regular) water. However, the heavy water ice cube sinks to the bottom of the glass because the extra mass causes the density of the heavy water ice to be greater than the density of the liquid regular water, and therefore it does not float.

Use this Build an Atom simulator to build atoms of the first 10 elements, see which isotopes exist, check nuclear stability, and gain experience with isotope symbols.
Natural Abundance
Because each proton and each neutron contributes 1 amu to the mass of an atom, and each electron contributes far less, the atomic mass of a single atom is approximately equal to its mass number (a whole number). However, the average masses of atoms of most elements are not whole numbers because most elements exist naturally as mixtures of two or more isotopes.
The mass of an element shown in a periodic table or listed in a table of atomic masses is a weighted average mass of all the isotopes present in a naturally occurring sample of that element. This is equal to the sum of each individual isotope’s mass multiplied by its fractional abundance.
average mass = ∑i (fractional abundance × isotopic mass)i
For example, the element boron is composed of two isotopes: 19.9% of all boron atoms are 10B with a mass of 10.0129 amu, and the remaining 80.1% are 11B with a mass of 11.0093 amu. The average atomic mass for boron is calculated to be:
| boron average mass | = | (0.199 × 10.0129 amu) + (0.801 × 11.0093 amu) |
| = | 1.99 amu + 8.82 amu | |
| = | 10.81 amu |
It is important to understand that no single boron atom weighs exactly 10.8 amu—10.8 amu is the average mass of all boron atoms, and individual boron atoms weigh either 10 amu or 11 amu.
Example 1
Calculation of Average Atomic Mass
A meteorite found in central Indiana contains traces of the noble gas neon picked up from the solar wind during the meteorite’s trip through the solar system. Analysis of a sample of the gas showed that it consisted of 91.84% 20Ne (mass 19.9924 amu), 0.47% 21Ne (mass 20.9940 amu), and 7.69% 22Ne (mass 21.9914 amu). What is the average mass of the neon in the solar wind?
Solution
| neon average mass | = | (0.9184 × 19.9924 amu) + (0.0047 × 20.9940 amu) + (0.0769 × 21.9914 amu) |
| = | (18.36 + 0.099 + 1.69) amu | |
| = | 20.15 amu |
The average mass of neon in the solar wind is 20.15 amu. (The average mass of a terrestrial neon atom is 20.1796 amu. This result demonstrates that we may find slight differences in the natural abundance of isotopes depending on their origin.)
Check Your Learning
A sample of magnesium is found to contain 78.70% of 24Mg atoms (mass 23.98 amu), 10.13% of 25Mg atoms (mass 24.99 amu), and 11.17% of 26Mg atoms (mass 25.98 amu). Calculate the average mass of Mg.
Answer:
24.31 amu
We can also do variations of this type of calculation, as shown in the next example.
Example 2
Calculation of Percent Abundance
Naturally occurring chlorine consists of 35Cl (mass 34.96885 amu) and 37Cl (mass 36.96590 amu), with an average mass of 35.453 amu. What is the percent composition of Cl in terms of these two isotopes?
Solution
The average mass of chlorine is the fraction that is 35Cl times the mass of 35Cl plus the fraction that is 37Cl times the mass of 37Cl.
chlorine average mass = (fraction of 35Cl × mass of 35Cl) + (fraction of 37Cl × mass of 37Cl)
If we let x represent the fraction that is 35Cl, then the fraction that is 37Cl is represented by 1.00 − x.
(The fraction that is 35Cl + the fraction that is 37Cl must add up to 1, so the fraction of 37Cl must equal 1.00 − the fraction of 35Cl.)
Substituting this into the average mass equation, we have:
| 35.453 amu | = | (x × 34.96885 amu) + [(1.00 – x) × 36.96590 amu] |
| 35.453 | = | 34.96885x + 36.96590 – 36.96590x |
| 1.99705x | = | 1.513 |
| x | = |  |
| x | = | 0.7576 |
Therefore, x = 0.7576, which means that 1.00 − 0.7576 = 0.2424. The result is that chlorine consists of 75.76% 35Cl and 24.24% 37Cl.
Check Your Learning
Naturally occurring copper consists of 63Cu (mass 62.9296 amu) and 65Cu (mass 64.9278 amu), with an average mass of 63.546 amu. What is the percent composition of Cu in terms of these two isotopes?
Answer:
69.15% Cu-63 and 30.85% Cu-65
Visit this site to make mixtures of the main isotopes of the first 18 elements, gain experience with average atomic mass, and check naturally occurring isotope ratios using the Isotopes and Atomic Mass simulation.
Mass Spectrometer
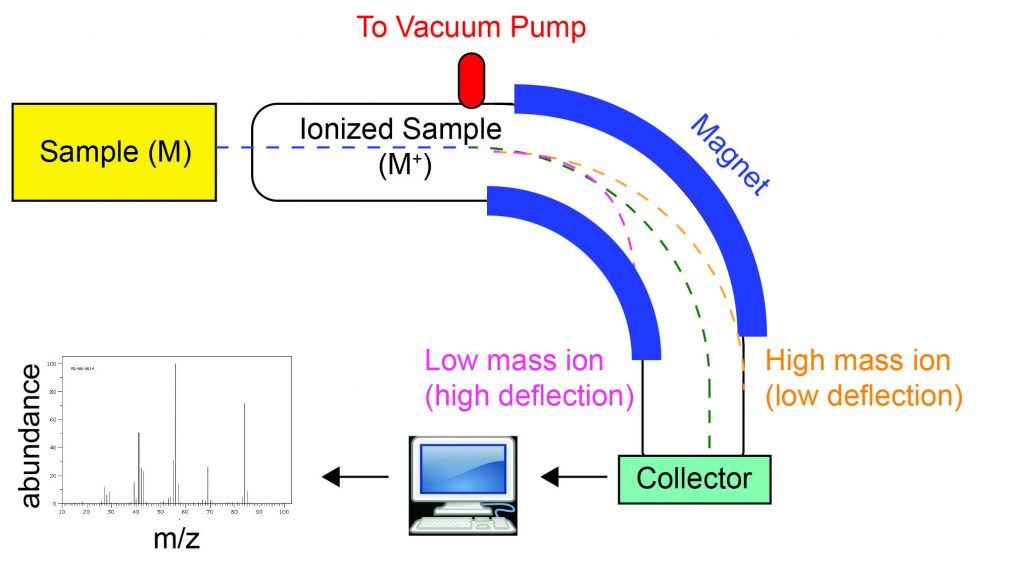
The occurrence and natural abundance of isotopes can be experimentally determined using an instrument called a mass spectrometer. Mass spectrometry (MS) is widely used in chemistry, forensics, medicine, environmental science, and many other fields to analyze and help identify the substances in a sample of material. There are many types of mass spectrometers, but we will concern ourselves with two styles: hard ionization and soft ionization mass spectrometers. In a hard-ionization mass spectrometer (Figure 2), the sample is vaporized and exposed to a high-energy plasma that causes any chemical bonds in the sample to be broken and the constituent atoms to become electrically charged, typically by losing one or more electrons. These cations then pass through a (variable) electric or magnetic field that deflects each cation’s path to an extent that depends on both its mass and charge (similar to how the path of a large steel ball bearing rolling past a magnet is deflected to a lesser extent than that of a small steel BB). The magnetic field deflects low mass ions more than high mass ions of the same charge. The ions are detected, and a plot of the relative number of ions generated versus their mass-to-charge ratios (a mass spectrum) is made. The height of each vertical feature or peak in a mass spectrum is proportional to the fraction of ions with the specified mass-to-charge ratio. Mass spectrometers can measure masses with very high resolution, on the order of 0.0001 amu. Thus, atoms with only slight differences in mass, such as isotopes, are readily detected and their relative abundances measured.
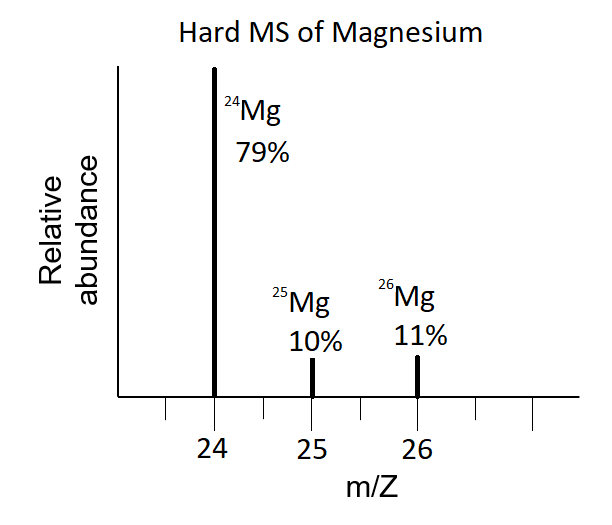
Mass spectra of elements reveal the isotopic composition of the elements. The hard-ionization mass spectrum of a sample of Mg exhibits three peaks at mass-to-charge ratios (m/Z) of 24, 25, and 26 amu (Figure 3), indicating that the element magnesium consists of three isotopes. Although it is Mg ions that arrive at the detector of the mass spectrometer and not Mg atoms, the numbers on the x-axis indicate the mass of each atom of the isotope because the mass of a Mg ion is almost the same as a Mg atom. The relative height of each peak, often expressed as a percentage value, are the natural abundance of each isotope: 79%, 10%, and 11%, respectively, the sum of which is 100%. The element magnesium therefore has 79% of the isotope 24Mg with 12 neutrons and 12 protons for a total mass of 24 amu. Because all Mg atoms have 12 protons, the two less abundant isotopes have 13 and 14 neutrons.
The main difference between a hard-ionization mass spectrometer and a soft-ionization mass spectrometer is that soft-ionization does not break the covalent bonds of a molecule. Therefore, instead of atomic ions being generated from the sample, soft-ionization mass spectrometer forms molecular ions. These molecular ions are deflected, depending on their mass-to-charge ratio, as they fly through the mass spectrometer, and the resulting mass spectrum tells us the molecular weight of the whole compound and its relative abundance.
See an animation that explains mass spectrometry. Watch this video from the Royal Society for Chemistry for a brief description of the rudiments of mass spectrometry.
Mass Spectrometry of Molecular Elements
We’ve learned in the previous module on atoms and molecules that a chemical formula uses symbols and subscripts to represent the identity and abundance of atoms in a compound. But, how do we know this information? The previous section discussed the general analysis of the natural abundance of isotopes. Here, we’ll discuss simplified analysis of molecules through hard and soft ionization of molecules.
When a molecule is subjected to hard ionization, all covalent bonds are broken to produce monatomic ions. In the mass spectrum of hard MS, the mass to charge ratio (m/Z) on the x-axis tells the mass of the ion (i.e., amu if all ions have a +1 charge). The identity of the ion can then be inferred using the periodic table and its relative abundance determined using the height (y-value) of the peak. On the other hand, soft MS does not break the covalent bonds of the molecule. Because the molecule remains intact, soft MS tells the molecular weight of the whole compound on the x-axis, and the relative abundance on the y-axis.
For an example, let’s consider the element bromine. Bromine has an average atomic mass of 79.90 amu, which is due to the presence of two stable isotopes: 50.65% of all bromine atoms are 79Br with a mass of 78.9183 amu, and the remaining 49.35% are 81Br with a mass of 80.9163 amu.
The elemental bromine exists as a molecule, with the formula Br2. In other words, a bromine molecule consists of two bromine atoms joined by a covalent bond. When a bromine molecule undergoes hard ionization, the covalent bond that connects the two bromine atom breaks, resulting in two Br+ ions. Therefore, the hard ionization mass spectrum of Br2 (Figure 4) shows only the atomic Br+.
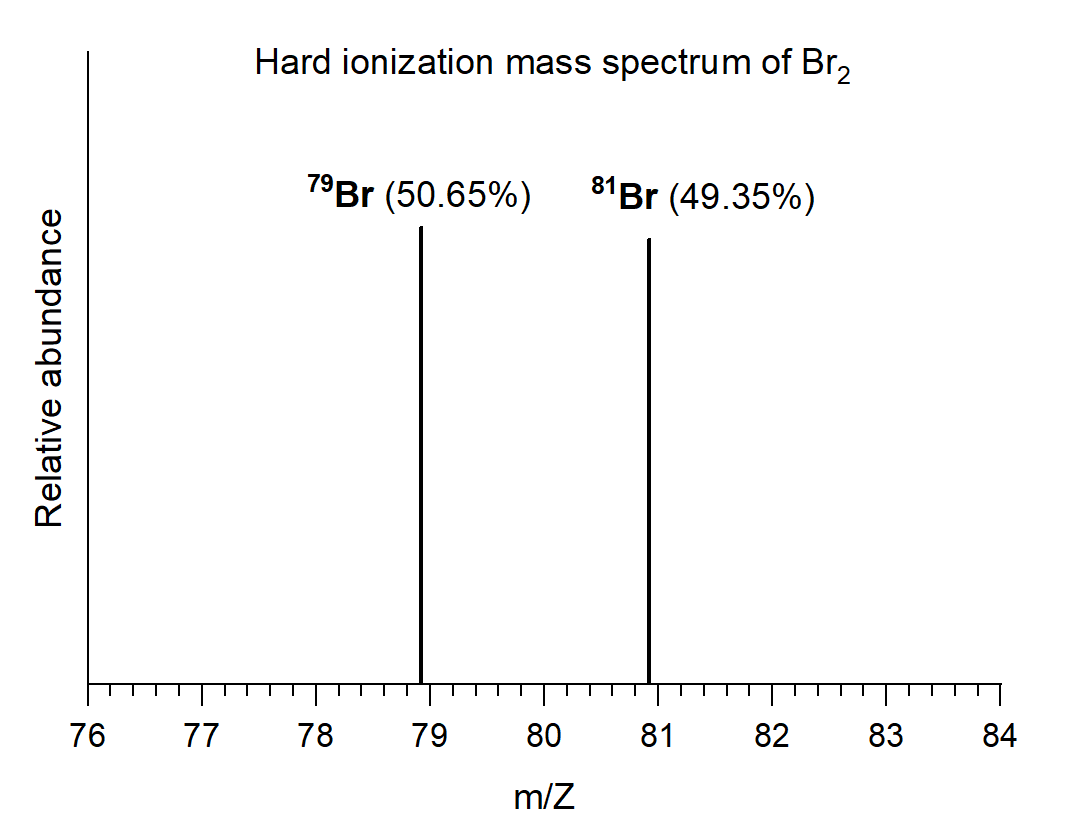
Note that even though the average atomic mass of bromine is 79.90 amu, there is no peak at m/Z = 79.90 because there is no bromine isotope with that mass.
Thus, hard ionization mass spectrum provides information about the individual atoms present in the sample.
In contrast, soft ionization mass spectrum provides information about the molecule itself. The covalent bond connecting the two bromine atoms remain intact during soft ionization, and a Br2+ ion (rather than Br+ ions) is detected on the collector in the mass spectrometer. The resulting soft ionization mass spectrum is shown in Figure 5.
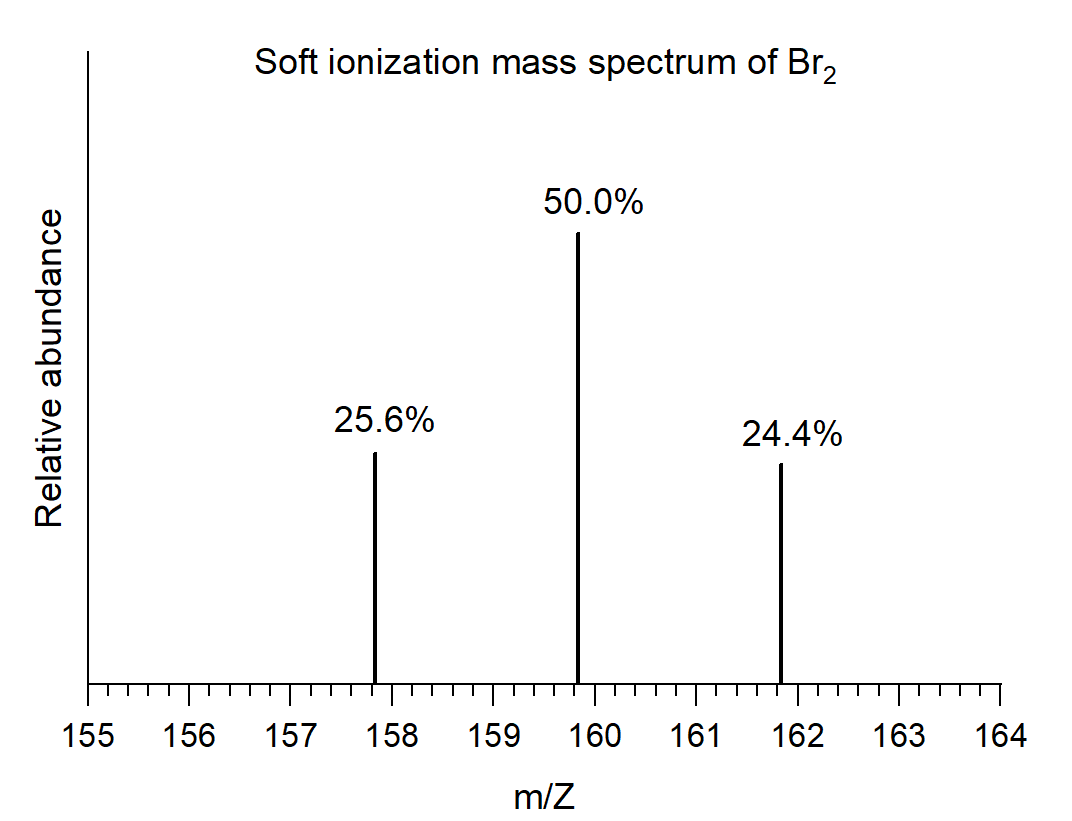
There are three peaks in this mass spectrum, and they correspond to the three possible masses of Br2 that can be formed from the Br isotopes.
- The Br2+ ion at m/Z = 157.84 amu contains two 79Br atoms covalently bonded together.
- The natural abundance of 79Br is 50.65%, therefore a Br2 molecule with two 79Br would have an abundance of 50.65% × 50.65% = 25.6%.
- The Br2+ ion at m/Z = 159.83 amu contains a 79Br atom covalently bonded to a 81Br atom.
- The natural abundance of 79Br is 50.65% and the natural abundance of 81Br is 49.35%.
- A Br2 molecule where the first atom is 79Br and the second atom is 81Br would have an abundance of 50.65% × 49.35% = 25.0%.
- A Br2 molecule where the first atom is 81Br and the second atom is 79Br would have an abundance of 49.35% × 50.65% = 25.0%.
- Therefore, the abundance of a Br2 molecule with one 79Br atom and one 81Br atom is 25.0% + 25.0% = 50.0%
- The natural abundance of 79Br is 50.65% and the natural abundance of 81Br is 49.35%.
- The Br2+ ion at m/Z = 161.83 amu contains two 81Br atoms covalently bonded together.
- The natural abundance of 81Br is 49.35%, therefore a Br2 molecule with two 81Br would have an abundance of 49.35% × 49.35% = 24.4%.
| Br2 composition | Br2 mass | Br2 abundance |
| 79Br-79Br | 78.918 amu + 78.918 amu = 157.84 amu | 0.5065 × 0.5065 = 0.2565 |
| 79Br-81Br | 78.918 amu + 80.916 amu = 159.83 amu | 0.5065 × 0.4935 = 0.2500 |
| 81Br-79Br | 80.916 amu + 78.918 amu = 159.83 amu | 0.4935 × 0.5065 = 0.2500 |
| 81Br-81Br | 80.916 amu + 80.916 amu = 161.83 amu | 0.4935 × 0.4935 = 0.2435 |
Therefore, just like there’s an average atomic mass, there is an average molecular mass. For Br2, the average molecular mass is
| Br2 average mass | = | (0.2565 × 157.84 amu) + (0.5000 × 159.83 amu) + (0.2435 × 161.83 amu) |
| = | 159.8 amu |
(The average molecular mass can also be calculated from the average atomic mass. For Br2, it would be: 79.90 amu + 79.90 amu = 159.8 amu.)
Key Concepts and Summary
Isotopes of an element are atoms with the same atomic number but different mass numbers; isotopes of an element, therefore, differ from each other only in the number of neutrons within the nucleus. When a naturally occurring element is composed of several isotopes, the atomic mass of the element represents the average of the masses of the isotopes involved.
Mass spectrometry is a powerful tool to identify elements by their mass. We can use hard ionization to break apart the molecule and determine the identity of the constituent atoms (based on the location of the peaks) and soft ionization to determine the molecular mass of a molecule since soft MS does not break the molecule apart into its constituent atoms.
Key Equations
- average mass = ∑i (fractional abundance × isotopic mass)i
Glossary
- atomic mass
- average mass of atoms of an element, expressed in amu
- isotopes
- atoms that contain the same number of protons but a different number of neutrons
Chemistry End of Section Exercises
Isotopes
- Visit the PhET Isotopes and Atomic Mass simulation site and select the “Mix Isotopes” tab, hide the “Percent Composition” and “Average Atomic Mass” boxes, and then select the element boron.
- Write the symbols of the isotopes of boron that are shown as naturally occurring in significant amounts.
- Predict the relative amounts (percentages) of these boron isotopes found in nature. Explain the reasoning behind your choice.
- Add isotopes to the black box to make a mixture that matches your prediction in (b). You may drag isotopes from their bins or click on “More” and then move the sliders to the appropriate amounts.
- Reveal the “Percent Composition” and “Average Atomic Mass” boxes. How well does your mixture match with your prediction? If necessary, adjust the isotope amounts to match your prediction.
- Select “Nature’s mix” of isotopes and compare it to your prediction. How well does your prediction compare with the naturally occurring mixture? Explain. If necessary, adjust your amounts to make them match “Nature’s” amounts as closely as possible.
- Pick an element from this list of isotope abundances that has three naturally occurring isotopes, and find the average mass of the element given the abundances of its isotopes.
- What is the correct symbol for an isotope containing 25 protons, 30 neutrons, and 23 electrons?
- Give the number of protons, electrons, and neutrons in neutral atoms of each of the following isotopes:
- In each pair below, indicate if the number of protons, neutrons, or electrons is the same or different.
- 54Cr and 55Mn
- 20Ne and 23Na+


Natural Abundance
- Average atomic masses listed by IUPAC are based on a study of experimental results. Bromine has two isotopes 79Br and 81Br, whose masses (78.9183 and 80.9163 amu) and abundances (50.69% and 49.31%) were determined in earlier experiments. Calculate the average atomic mass of bromine based on these experiments.
- Variations in average atomic mass may be observed for elements obtained from different sources. Lithium provides an example of this. The isotopic composition of lithium from naturally occurring minerals is 7.5% 6Li and 92.5% 7Li, which have masses of 6.01512 amu and 7.01600 amu, respectively. A commercial source of lithium, recycled from a military source, was 3.75% 6Li (and the rest 7Li). Calculate the average atomic mass values for each of these two sources.
- The 18O:16O abundance ratio in some meteorites is greater than that used to calculate the average atomic mass of oxygen on earth. Is the average mass of an oxygen atom in these meteorites greater than, less than, or equal to that of a terrestrial oxygen atom?
- Element X has two major isotopes:
 and
and  .
.
- What is the chemical symbol of element X?
- Which isotope is more abundant, or ? How can you tell?
Answers to Chemistry End of Section Exercises
- (a) 10B and 11B
(b) Boron has an average atomic mass of that is closer to 11 amu than 10 amu, so there should be more 11B than 10B. For example, we can estimate 65% 11B and 35% 10B
(c) check
(d) Average atomic mass of the example estimation is 10.661 amu
(e) the example estimation is off; nature’s mix is 80.1% 11B and 19.9% 10B with average atomic mass of 10.811 amu. - Let us use neon as an example. Since there are three isotopes, there is no way to be sure to accurately predict the abundances to make the total of 20.18 amu average atomic mass. Let us guess that the abundances are 9% Ne-22, 91% Ne-20, and only a trace of Ne-21. The average mass would be 20.18 amu. Checking the nature’s mix of isotopes shows that the abundances are 90.48% Ne-20, 9.25% Ne-22, and 0.27% Ne-21, so our guessed amounts have to be slightly adjusted.

- (a) 3 protons, 3 electrons, 4 neutrons;
(b) 52 protons, 52 electrons, 73 neutrons;
(c) 47 protons, 47 electrons, 62 neutrons;
(d) 7 protons, 7 electrons, 8 neutrons;
(e) 15 protons, 15 electrons, 16 neutrons - (a) Number of protons = different, number of neutrons = same, number of electrons = different
(b) Number of protons = different, number of neutrons = different, number of electrons = same - 79.90 amu
- From natural source: 6.94 amu; from commercial source: 6.98 amu
- The average mass of an oxygen atom in meteroites is greater than the average mass of a terrestrial oxygen atom because there is more O-18 that occurs in a meterorite than does on earth.
- (a) Re
(b) . The average mass of a Re atom is 186.2 amu, which is closer to 187 than 185. So there must be more atoms with a mass of 187.
Please use this form to report any inconsistencies, errors, or other things you would like to change about this page. We appreciate your comments. 🙂
