D30.1 Acid-Base Indicators

Acid-base indicators are substances with intense colors that change color when [H3O+] reaches a particular value. Acid-base indicators are either weak organic acids or weak organic bases and can be used to determine the pH of a solution.

For example, the equilibrium in a solution of the acid-base indicator methyl orange, a weak acid, can be represented by an equation in which we use “HIn” as a simple representation for the complex methyl orange molecule:

 \begin{array}{ccccccc} \text{HIn}(aq) & + & \text{H}_2\text{O}(l) & {\rightleftharpoons} & \text{H}_3\text{O}^{+}(aq) & + & \text{In}^{-}(aq) \\[0.5em] \text{red} & & & & & & \text{yellow} \end{array}
 K_{\text{a}} = \dfrac{[\text{H}_3\text{O}^{+}][\text{In}^{-}]}{[\text{HIn}]} = 4.0\;\times\;10^{-4}

If we add an acid to a solution containing methyl orange, the increased [H3O+] will result in more HIn (the nonionized red form) at equilibrium. If we add a base, more In (the anionic yellow form) will be present. The overall color of the solution is the visible result of the ratio of the concentrations of the two species: if most of the indicator is present as In, then we see the color yellow; if most is present as HIn, then we see the color red.

To consider this more quantitatively, we can rearrange the equation for Ka and write:

 \dfrac{[\text{In}^{-}]}{[\text{HIn}]} = \dfrac{[\text{substance with yellow color}]}{[\text{substance with red color}]} = \dfrac{K_{\text{a}}}{[\text{H}_3\text{O}^{+}]}

When [H3O+] = Ka,HIn, 50% of the indicator is present in the red form (HIn) and 50% is in the yellow ionic form (In), and the solution overall appears orange in color. When [H3O+] increases to 8 × 10⁻⁴ M (pH = 3.1), the solution turns red. No significant change in color is visible for further increase in [H3O+]. When [H3O+] decreases to 4 × 10⁻⁵ M (pH = 4.4), most of the indicator is in the yellow ionic form, and further decrease in [H3O+] does not produce a visible color change. The pH range of 3.1 – 4.4 is the color-change interval of methyl orange, the range of pH values over which the color change takes place.

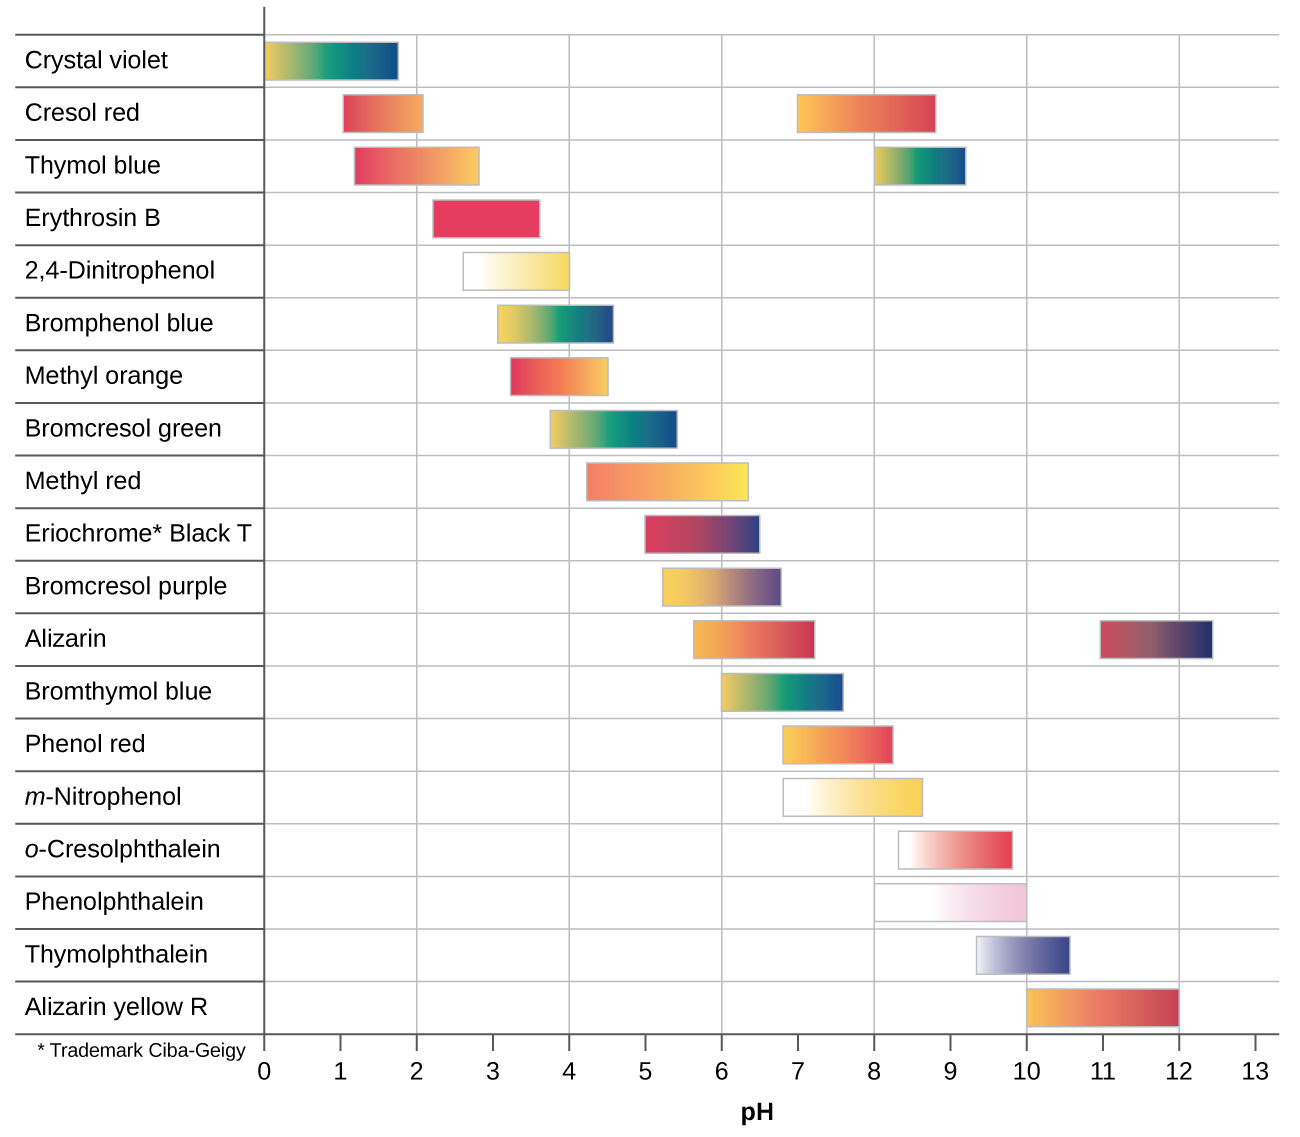
There are many different acid-base indicators. Their color-change intervals have a wide range of pH values (see figure below). Universal indicators and pH paper contain a mixture of indicators and exhibit different colors at different pH values.

This figure provides a graphical representation of indicators and color ranges. A horizontal axis is labeled “p H.” This axis begins at zero and increases by ones up to 13. The left side of the graphic provides a column with the names of indicators. To the right of each indicator name is either one or two colored bars that are shaded according to the indicator color at various p H ranges. From the top, the first row is labeled “Crystal violet.” The associated colored bar is yellow at its left end at a p H of 0 and changes to green and blue moving right to its endpoint at a p H of 1.8. The second row is labeled “Cresol red.” The associated colored bar is red at its left end at a p H of 1 and changes to orange and yellow moving right to its endpoint at a p H of just over 2. A second bar to its right is yellow at a p H of around 7 and proceeds through orange to red at a p H of about 9. The third row is labeled “Thymol blue.” The associated colored bar is red at its left end at a p H of nearly 1.2 and changes to orange and red moving right to its endpoint at a p H of 2.8. A second bar begins in yellow at a p H of 8 and proceeds through green and blue to its end at a p H of around 9.1. The fourth row is labeled “Erythrosin B.” The associated colored bar is red from a p H of 2.2 to its endpoint at a p H of 3.6. The fifth row is labeled “2 comma 4 dash Dinitrophenol.” The associated colored bar is white at its left end at a p H of 2.6 and changes to yellow at its endpoint at a p H of 4. The sixth row is labeled “Bromophenol blue.” The associated colored bar is yellow at its left end at a p H of 3 and changes to green and blue moving right to its endpoint at a p H of 4.5. The seventh row is labeled “Methyl orange.” The associated colored bar is red-orange at its left end at a p H of 4.2 and changes to yellow moving right to its endpoint at a p H of 6.3. The eighth row is labeled “Bromocresol green.” The associated colored bar is yellow at its left end at a p H of 3.8 and changes to green and blue moving right to its endpoint at a p H of 5.4. The ninth row is labeled “Methyl red.” The associated colored bar is orange at its left end at a p H of 4.2 and changes to yellow moving right to its endpoint at a p H of 6.3. The tenth row is labeled “Eriochrome * Black T.” The associated colored bar is red at its left end at a p H of 5 and changes to purple and blue moving right to its endpoint at a p H of 6.5. The eleventh row is labeled “Bromocresol purple.” The associated colored bar is yellow at its left end at a p H of 5.2 and changes to purple moving right to its endpoint at a p H of 6.8. The twelfth row is labeled “Alizarin.” The first associated colored bar is yellow-orange at its left end at a p H of 5.7 and changes to red moving right to its endpoint at a p H of 7.2. A second bar begins in red at a p H of 11 and changes to purple, then dark blue at its right end at a p H of 12.4. The thirteenth row is labeled “Bromothymol blue.” The associated colored bar is yellow at its left end at a p H of 6 and changes to green and blue moving right to its endpoint at a p H of 7.6. The fourteenth row is labeled “Phenol red.” The associated colored bar is yellow-orange at its left end at a p H of 6.8 and changes to orange and red moving right to its endpoint at a p H of 8.2. The fifteenth row is labeled “m dash Nitrophenol.” The associated colored bar is white at its left end at a p H of 6.8 and changes to yellow moving right to its endpoint at a p H of 8.6. The sixteenth row is labeled “o dash Cresolphthalein.” The associated colored bar is white at its left end at a p H of 8.3 and changes to red moving right to its endpoint at a p H of 9.8. The seventeenth row is labeled “Phenolphthalein.” The associated colored bar is white at its left end at a p H of 8 and changes to pink moving right to its endpoint at a p H of 10. The eighteenth row is labeled “Thymolphthalein.” The associated colored bar is light blue at its left end at a p H of 9.3 and changes to a deep, dark blue moving right to its endpoint at a p H of 10.5. The nineteenth row is labeled “Alizarin yellow R.” The associated colored bar is yellow-orange at its left end at a p H of 10 and changes to red moving right to its endpoint at a p H of 12.
Figure: Acid-base indicator color-change intervals. This chart illustrates the ranges of color change for several acid-base indicators.

Titration curves can help in selecting an indicator that will provide a sharp color change at the equivalence point. The best selection is an indicator with a color-change interval that brackets the pH at the equivalence point of the titration. (We can also base our choice of indicator on the calculated pH at the equivalence point.)

The color-change intervals of three indicators are shown in Figure: Indicator Choices. The steep section of the titration curves of HCl and of CH3COOH spans the color-change interval of phenolphthalein. We can use phenolphthalein for titrations of either acid.

Figure: Indicator choices. The graph shows the titration of 25.00 mL of 0.100 M CH3COOH with 0.100 M NaOH (blue dotted curve) and the titration of 25.00 mL of 0.100 M HCl with 0.100 M NaOH (green curve). The color-change intervals of phenolphthalein, litmus, and methyl orange are indicated by the colored-shaded areas.

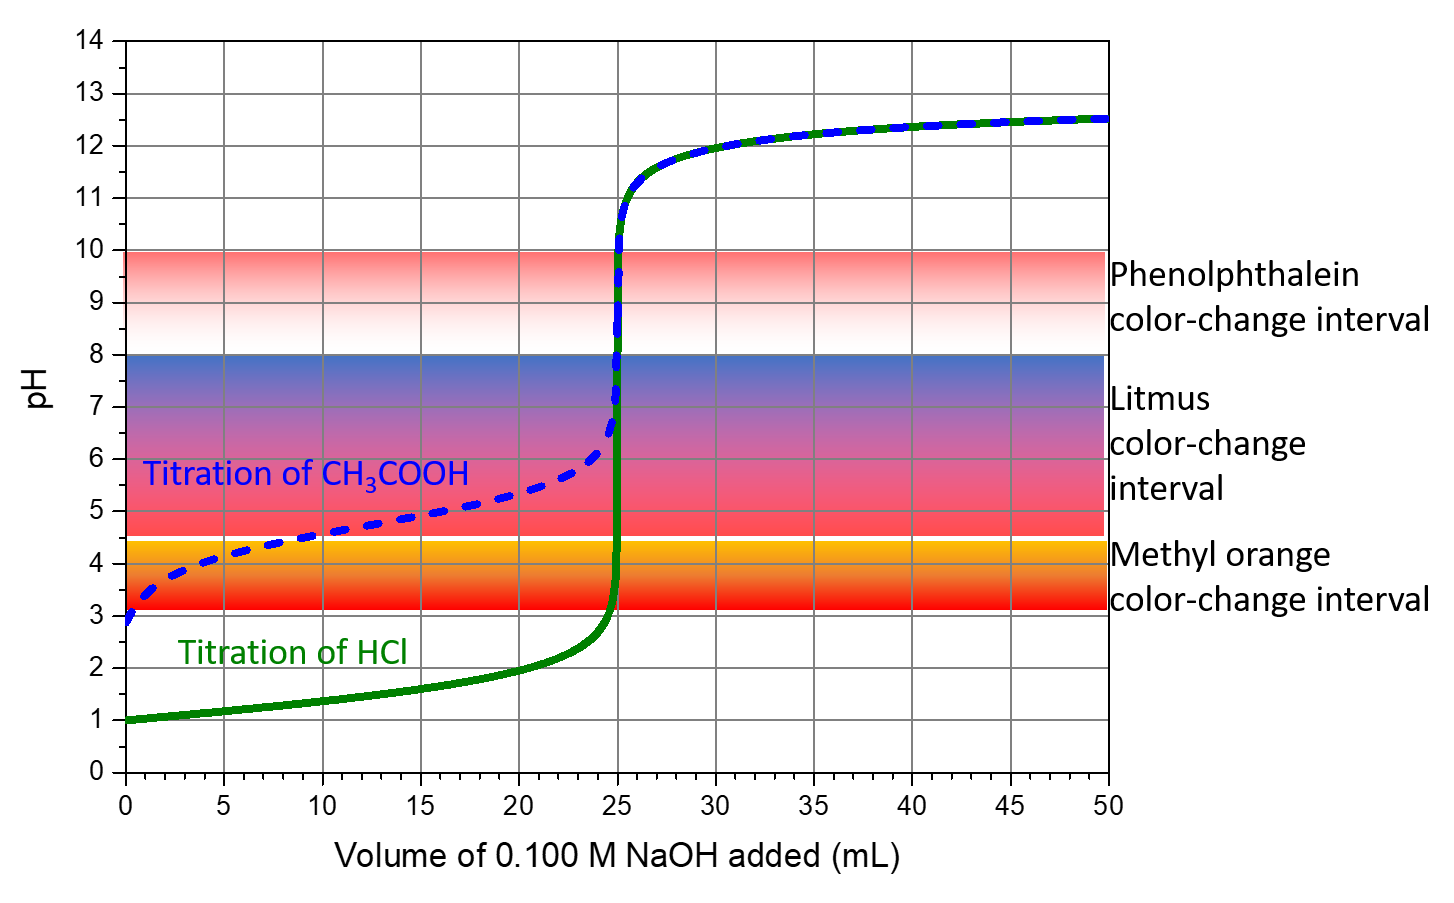
Litmus is a suitable indicator for the HCl titration. However, we should not use it for the CH3COOH titration because the solution pH is within the color-change interval when only ~8 mL of NaOH has been added, and it does not leave the range until 25 mL has been added. The color change would be very gradual, taking place during the addition of ~17 mL of NaOH, making litmus useless as an indicator of the equivalence point.

We can use methyl orange for the HCl titration, but it would not give very accurate results: (1) It completes its color change slightly before the equivalence point is reached (but very close to it, so this is not too serious); (2) it changes color during the addition of 0.5 mL of NaOH, which is not so sharp a color change as that of litmus or phenolphthalein. Methyl orange would be completely useless as an indicator for the CH3COOH titration. Its color change is completed long before the equivalence point is reached and hence provides no indication of the equivalence point.

Comments
Please use this form to report any inconsistencies, errors, or other things you would like to change about this page. We appreciate your comments. 🙂

License

Icon for the Creative Commons Attribution-NonCommercial-ShareAlike 4.0 International License

Chemistry 109 Fall 2021 Copyright © by John Moore; Jia Zhou; and Etienne Garand is licensed under a Creative Commons Attribution-NonCommercial-ShareAlike 4.0 International License, except where otherwise noted.