D2.1 Electromagnetic Radiation

The periodic table summarizes much information about chemical elements. That information can be better understood by assuming that physical and chemical properties of elements depend on the underlying structures of their atoms. An important way to learn about the structures of atoms is to study how energy, in the form of electromagnetic radiation, interacts with matter.

Activity: Preparation—Atomic Spectra and Atomic Structure

In your course notebook, make a heading for Atomic Spectra and Atomic Structure. After the heading write down what you remember about atomic spectra from courses you have already taken. Also write what you recall about the relation of spectra to atomic structure—how electrons are arranged in atoms. If there is anything you remember being puzzled about, write that down as well. We will ask you to refer back to what you have written when you complete this section.

Electromagnetic radiation consists of oscillating, perpendicular electric and magnetic fields that travel through space and can transfer energy. The oscillating fields (waves) are characterized by wavelength (λ, measured in meters, m) and frequency (ν, measured in hertz, Hz or s−1). In a vacuum, electromagnetic radiation travels at the speed of light (c):

λν = c = 2.998 × 10⁸ m/s

Electromagnetic radiation occurs in small, indivisible quantities of energy called photons. The energy of a photon, Ephoton, can be determined from either its frequency or its wavelength:

 E_\text{photon} = h\nu = \dfrac{hc}{\lambda}

In this equation h represents Planck’s constant; h = 6.626 × 10⁻³⁴ J s.

Exercise: Photon Energy from Wavelength

Your calculation in the above Exercise showed that the energy of a single photon is quite small. Most interactions of electromagnetic radiation and matter involve lots of photons and lots of atoms. The total energy transferred is proportional to the number of photons, N. If all photons have the same frequency:

 E_\text{electromagnetic radiation} = N\times E_\text{photon} = Nh\nu = N\dfrac{hc}{\lambda}

Notice that electromagnetic radiation has been described as involving wave motion and also as a number of particles (photons). Originally, scientists thought that electromagnetic radiation could be described entirely by a wave model, but that model was unable to predict all experimental observations. Consequently, both wave and particle models need to be combined for full understanding of electromagnetic radiation.

The figure below shows the enormous range of all types of electromagnetic radiation: Frequencies of 105 Hz to 1020 Hz, that is, wavelengths of 103 m (km) to 10−12 m (pm) have been observed. What we can see, visible light, is only a tiny portion (380-740 nm) of that range.

The figure includes a portion of the electromagnetic spectrum which extends from gamma radiation at the far left through x-ray, ultraviolet, visible, infrared, terahertz, and microwave to broadcast and wireless radio at the far right. At the top of the figure, inside a grey box, are three arrows. The first points left and is labeled, “Increasing energy E.” A second arrow is placed just below the first which also points left and is labeled, “Increasing frequency nu.” A third arrow is placed just below which points right and is labeled, “Increasing wavelength lambda.” Inside the grey box near the bottom is a blue sinusoidal wave pattern that moves horizontally through the box. At the far left end, the waves are short and tightly packed. They gradually lengthen moving left to right across the figure, resulting in significantly longer waves at the right end of the diagram. Beneath the grey box are a variety of photos aligned above the names of the radiation types and a numerical scale that is labeled, “Wavelength lambda ( m ).” This scale runs from 10 superscript negative 12 meters under gamma radiation increasing by powers of ten to a value of 10 superscript 3 meters at the far right under broadcast and wireless radio. X-ray appears around 10 superscript negative 10 meters, ultraviolet appears in the 10 superscript negative 8 to 10 superscript negative 7 range, visible light appears between 10 superscript negative 7 and 10 superscript negative 6, infrared appears in the 10 superscript negative 6 to 10 superscript negative 5 range, teraherz appears in the 10 superscript negative 4 to 10 superscript negative 3 range, microwave infrared appears in the 10 superscript negative 2 to 10 superscript negative 1 range, and broadcast and wireless radio extend from 10 to 10 superscript 3 meters. Labels above the scale are placed to indicate 1 n m at 10 superscript negative 9 meters, 1 micron at 10 superscript negative 6 meters, 1 millimeter at 10 superscript negative 3 meters, 1 centimeter at 10 superscript negative 2 meters, and 1 foot between 10 superscript negative 1 meter and 10 superscript 0 meters. A variety of images are placed beneath the grey box and above the scale in the figure to provide examples of related applications that use the electromagnetic radiation in the range of the scale beneath each image. The photos on the left above gamma radiation show cosmic rays and a multicolor PET scan image of a brain. A black and white x-ray image of a hand appears above x-rays. An image of a patient undergoing dental work, with a blue light being directed into the patient's mouth is labeled, “dental curing,” and is shown above ultraviolet radiation. Between the ultraviolet and infrared labels is a narrow band of violet, indigo, blue, green, yellow, orange, and red colors in narrow, vertical strips. From this narrow band, two dashed lines extend a short distance above to the left and right of an image of the visible spectrum. The image, which is labeled, “visible light,” is just a broader version of the narrow bands of color in the label area. Above infrared are images of a television remote and a black and green night vision image. At the left end of the microwave region, a satellite radar image is shown. Just right of this and still above the microwave region are images of a cell phone, a wireless router that is labeled, “wireless data,” and a microwave oven. Above broadcast and wireless radio are two images. The left most image is a black and white medical ultrasound image. A wireless AM radio is positioned at the far right in the image, also above broadcast and wireless radio.
Figure: Electromagnetic Spectrum. Portions of the electromagnetic spectrum are shown. Examples of some applications for various wavelengths include positron emission tomography (PET) scans, X-ray imaging, remote controls, wireless Internet, cellular telephones, and radios. (credits: “Cosmic ray”: NASA; “PET scan”: NIH; “X-ray”: Dr. Jochen Lengerke; “Dental curing”: Department of the Navy; “Night vision”: Department of the Army; “Remote”: Emilian Robert Vicol; “Cell phone”: Brett Jordan; “Microwave oven”: Billy Mabray; “Ultrasound”: Jane Whitney; “AM radio”: Dave Clausen)

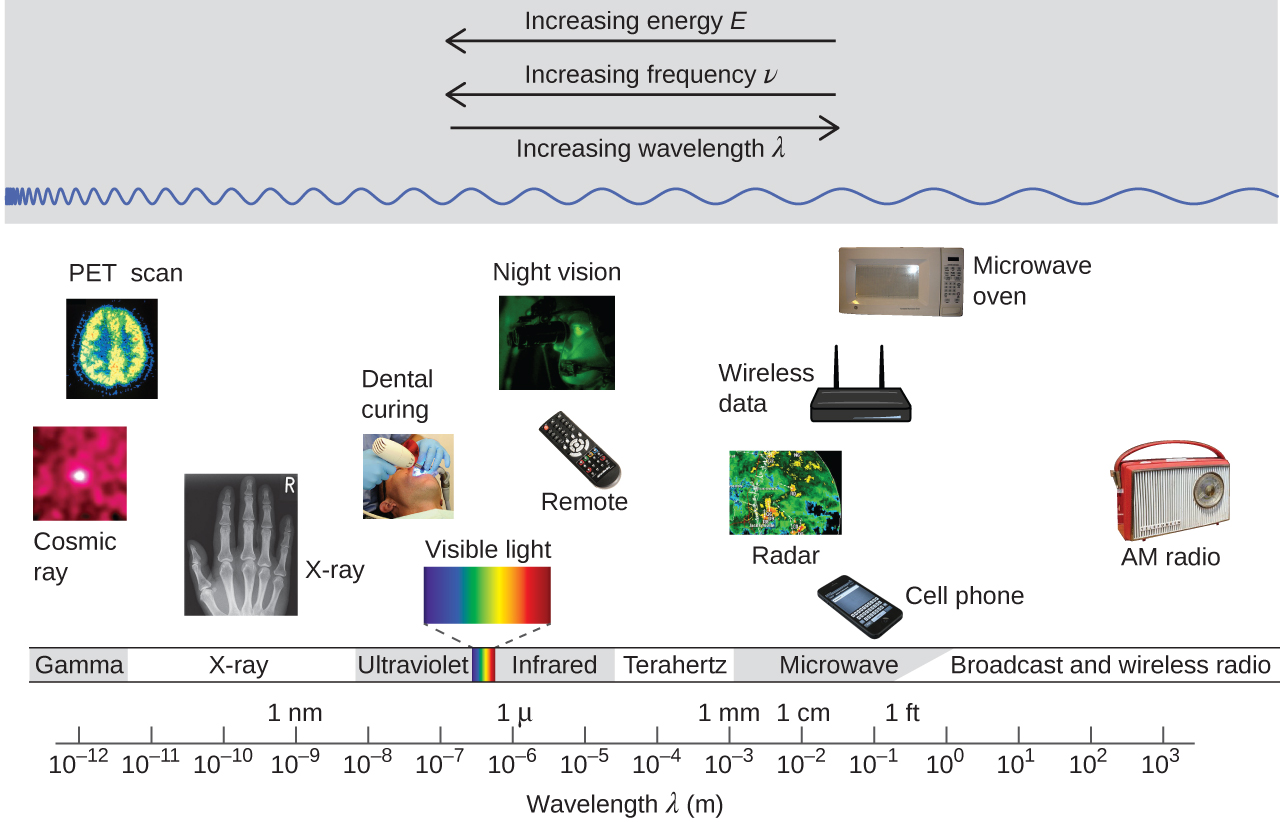
Different parts of the electromagnetic spectrum typically use different units: Low-energy photons, such as microwaves and radio waves, are specified in frequencies (MHz or GHz); mid-energy photons, such as infrared and visible light, are specified in wavelengths (μm, nm, pm, or Å); high-energy photons, such as x-rays and gamma-rays, are specified in energies (keV or MeV; 1 eV = 96.5 kJ/mol).  As the equation above shows, these units can readily be converted to one another.

Our eyes detect visible-range photons, allowing us to see the world around us. But scientific instruments allow us to “see” lots more by detecting photons over a much wider range of energies. For example, studies of atomic spectra via experiments involving interaction of gaseous matter with visible, ultraviolet, and infrared photons, led to a better understanding of the structure of atoms.

Comments
Please use this form to report any inconsistencies, errors, or other things you would like to change about this page. We appreciate your comments. 🙂

License

Icon for the Creative Commons Attribution-NonCommercial-ShareAlike 4.0 International License

Chemistry 109 Fall 2021 Copyright © by John Moore; Jia Zhou; and Etienne Garand is licensed under a Creative Commons Attribution-NonCommercial-ShareAlike 4.0 International License, except where otherwise noted.