
D4.3 Periodic Variation in Ionization Energies
In addition to atomic radius, several other properties vary depending on position in the periodic table. Like atomic radius, these properties depend on effective nuclear charge and size of atomic shell.
The quantum mechanics model for the hydrogen atom discussed ionization of the hydrogen atom: excitation of the electron from the n = 1 level to the limit of n → ∞:

Ionization energy (IE), the minimum energy required to remove an electron from the atomic orbital it occupies (exciting it to n = ∞), also applies to multi-electron atoms. As shown in this table of ionization energies, there are successive ionization energies, one for each electron.
The first ionization energy (IE1) is the minimum energy required to remove the least tightly bound electron, i.e. the electron in the highest energy orbital. It corresponds to the process:
The second ionization energy (IE2) is the minimum energy required for removing an electron from the 1+ cation, corresponding to:
And so forth.
Electrons in atoms have lower potential energy than when they are separated from the atom, so energy is always required to remove an electron from atoms or ions. Ionization is an endothermic process and IE values are always positive.
Ionization energies can be determined experimentally from atomic spectra or by shining light on a gas-phase sample and successively increasing the photon energy until ejection of an electron is observed. Such experiments also give us direct information about the atomic orbital the electron was occupying.
Exercise: Periodic Variation of Ionization Energy
In the preceding activity, you developed a general rule that across a period, IE1 increases with increasing atomic number, Z; down a group, IE1 decreases with increasing Z. Look at the Figure: Ionization Energies below and make certain you see how the data in the figure support both trends. There are a few systematic deviations from these trends, which also can be seen in the Figure.
Examine data presented in the figure. Identify all deviations from the trend that ionization energy increases across a period and decreases down a group. Click on each deviation involving an element in Period 1, Period 2, or Period 3.
Another deviation occurs when a subshell becomes more than half filled. For example, oxygen’s IE1 is slightly lower than that for nitrogen. The orbital diagram of oxygen shows that the last electron added (red) is forced to pair with another electron, because the 2p subshell is more than half full.
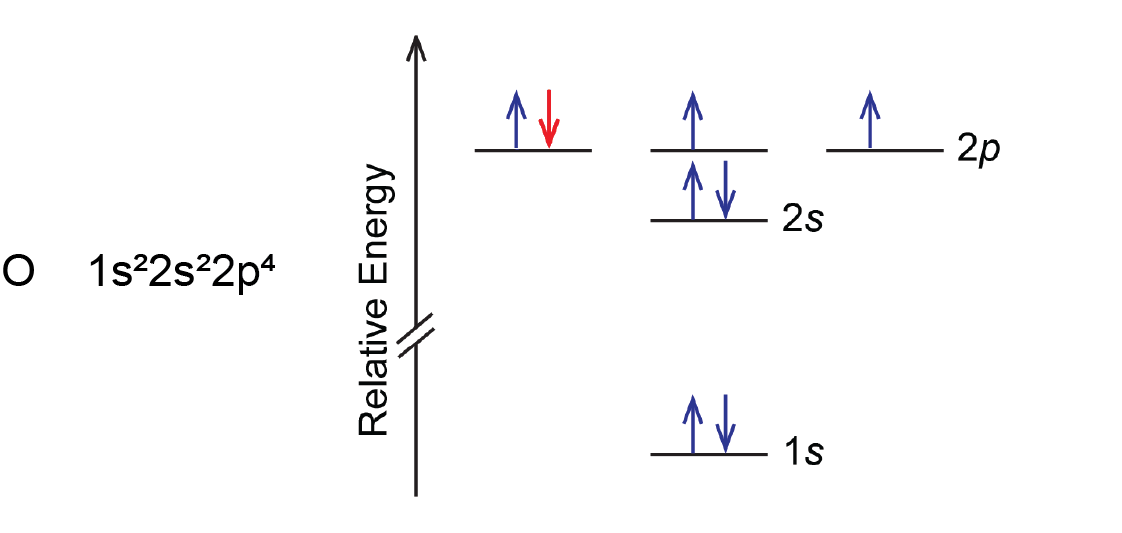
Loss of the electron (colored red in the orbital diagram) yields a greater reduction of electron–electron repulsion because there are no longer two electrons in the same orbital. This makes it easier to lose one electron from O and the ionization energy is smaller than expected. The same explanation applies to the dip for sulfur after phosphorus in Figure: Ionization Energies.
Looking at the successive IEs in the appendix, we see that for any element, IE1 < IE2 < IE3, and so forth, and this is due to the greater Zeff in successively more positive ions. However, sometimes the increase in successive IE is larger than expected. For example, consider the data in Table 1:
| Element | IE1 | IE2 | IE3 | IE4 | IE5 | IE6 | IE7 |
|---|---|---|---|---|---|---|---|
| K | 419 | 3069 | 4438 | 5876 | 7975 | 9620 | 11385 |
| Ca | 590 | 1145 | 4941 | 6465 | 8142 | 10496 | 12350 |
| Sc | 633 | 1244 | 2388 | 7130 | 8877 | 10720 | 13314 |
| Ga | 579 | 1982 | 2962 | 6194 | 8299 | 10874 | 13585 |
| Ge | 760 | 1537 | 3301 | 4409 | 9012 | 11183 | 13981 |
| As | 947 | 1949 | 2731 | 4834 | 6040 | 12302 | 14183 |
| Table. Successive Ionization Energies (IEs) for Some Period-4 Elements (kJ/mol) | |||||||
These observed ionization energies are consistent with the idea of valence electrons—electrons in outer shell(s) that are less bound and more energetically accessible, allowing them to participate in chemical transformations.
Please use this form to report any inconsistencies, errors, or other things you would like to change about this page. We appreciate your comments. 🙂
