
D31.2 Activation Energy
The aspects of a reaction energy diagram relevant to reaction kinetics is the energetic pathway connecting the reactants and products. For the cis–trans isomerization reaction:
the angle of rotation around the double bond is a good measure of the progress of the reaction. We can use this angle to delineate the x-axis in a reaction energy diagram.
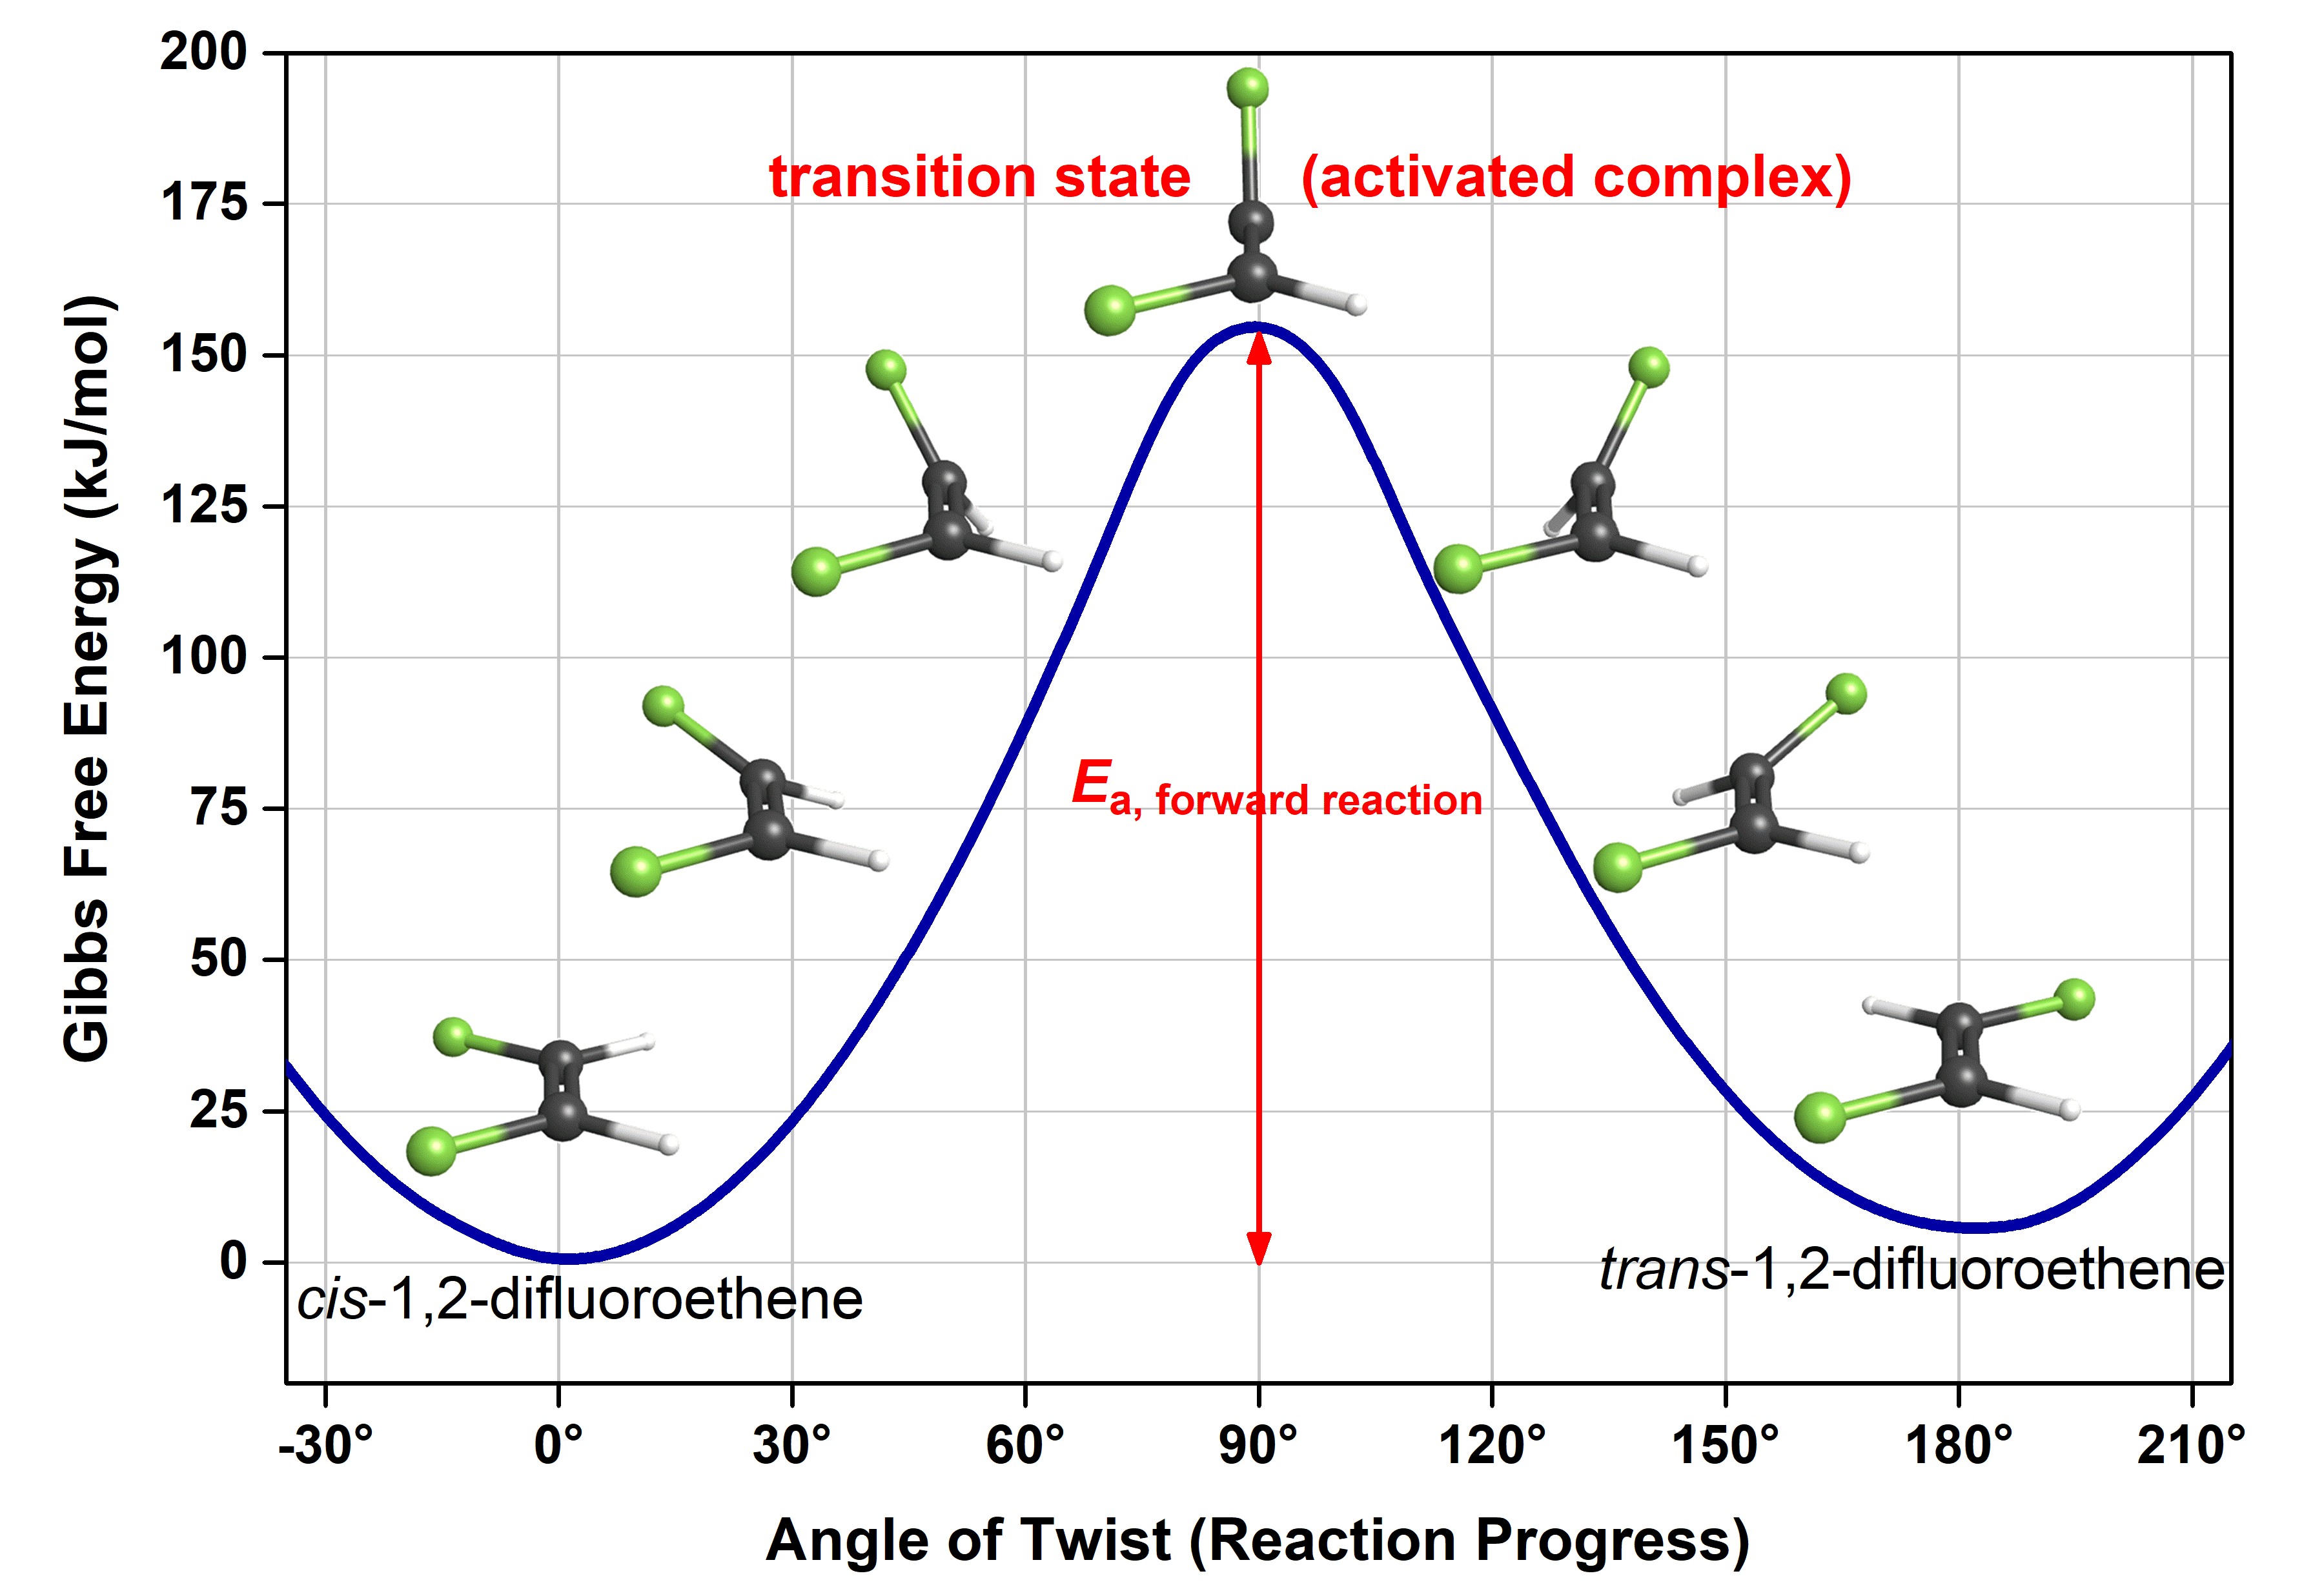
This figure is similar to the reaction energy diagram we saw before. The main difference is that here the reaction progress (x-axis) is more clearly defined, and hence it provides more detailed information. Note that while the x-axis of a reaction energy diagram is always “reaction progress”, the exact reaction coordinates that connect reactants to products is unique to each reaction. Therefore, you will most often see the simpler form of reaction energy diagrams.
Let’s use the more detailed reaction energy diagram to discuss a few crucial pieces of information. Here, the reactant (cis isomer) and product (trans isomer) are connected by a single transition state, which is a maximum on the reaction energy diagram. The transition-state structure (or activated complex) is the structure that corresponds to the transition state. Because a transition-state structure has greater energy than either reactant molecule(s) or product molecule(s), it is unstable (thermodynamically and kinetically) relative to both. Moreover, it exists at a maximum on the reaction energy diagram (in comparison, the reactant exists at a minimum, and the product also exists at a minimum, albeit a different minimum than the reactant). These characteristics make the transition-state structure have a very short existence time (typically < 10-15 s), and it is very difficult to observe them experimentally.
The difference in energy between the transition state and the reactant(s) is the activation energy (Ea) of the reaction going forward. Similarly, the difference in energy between the transition state the product(s) is the Ea of the reverse reaction. If all other factors affecting the rate are the same, the greater the activation energy is, the slower the reaction is.
If a cis-1,2-difluoroethene molecule does not have enough energy, which in this case is 158 kJ/mol (or 262 × 10-21 J/molecule), it cannot proceed to form trans-1,2-difluoroethene. For a collection of molecules, say a 1-L container of gaseous cis-1,2-difluoroethene at 1 bar, the average kinetic energy of all the molecules, KEavg, is directly proportional to the observed temperature:

where R is the gas constant, 8.314 J/K·mol. But we already know that there is a distribution of kinetic energies (and hence velocities) for individual molecules at a given temperature. These distributions of molecular energies for cis-1,2-difluoroethene gas molecules at various temperatures are shown below.
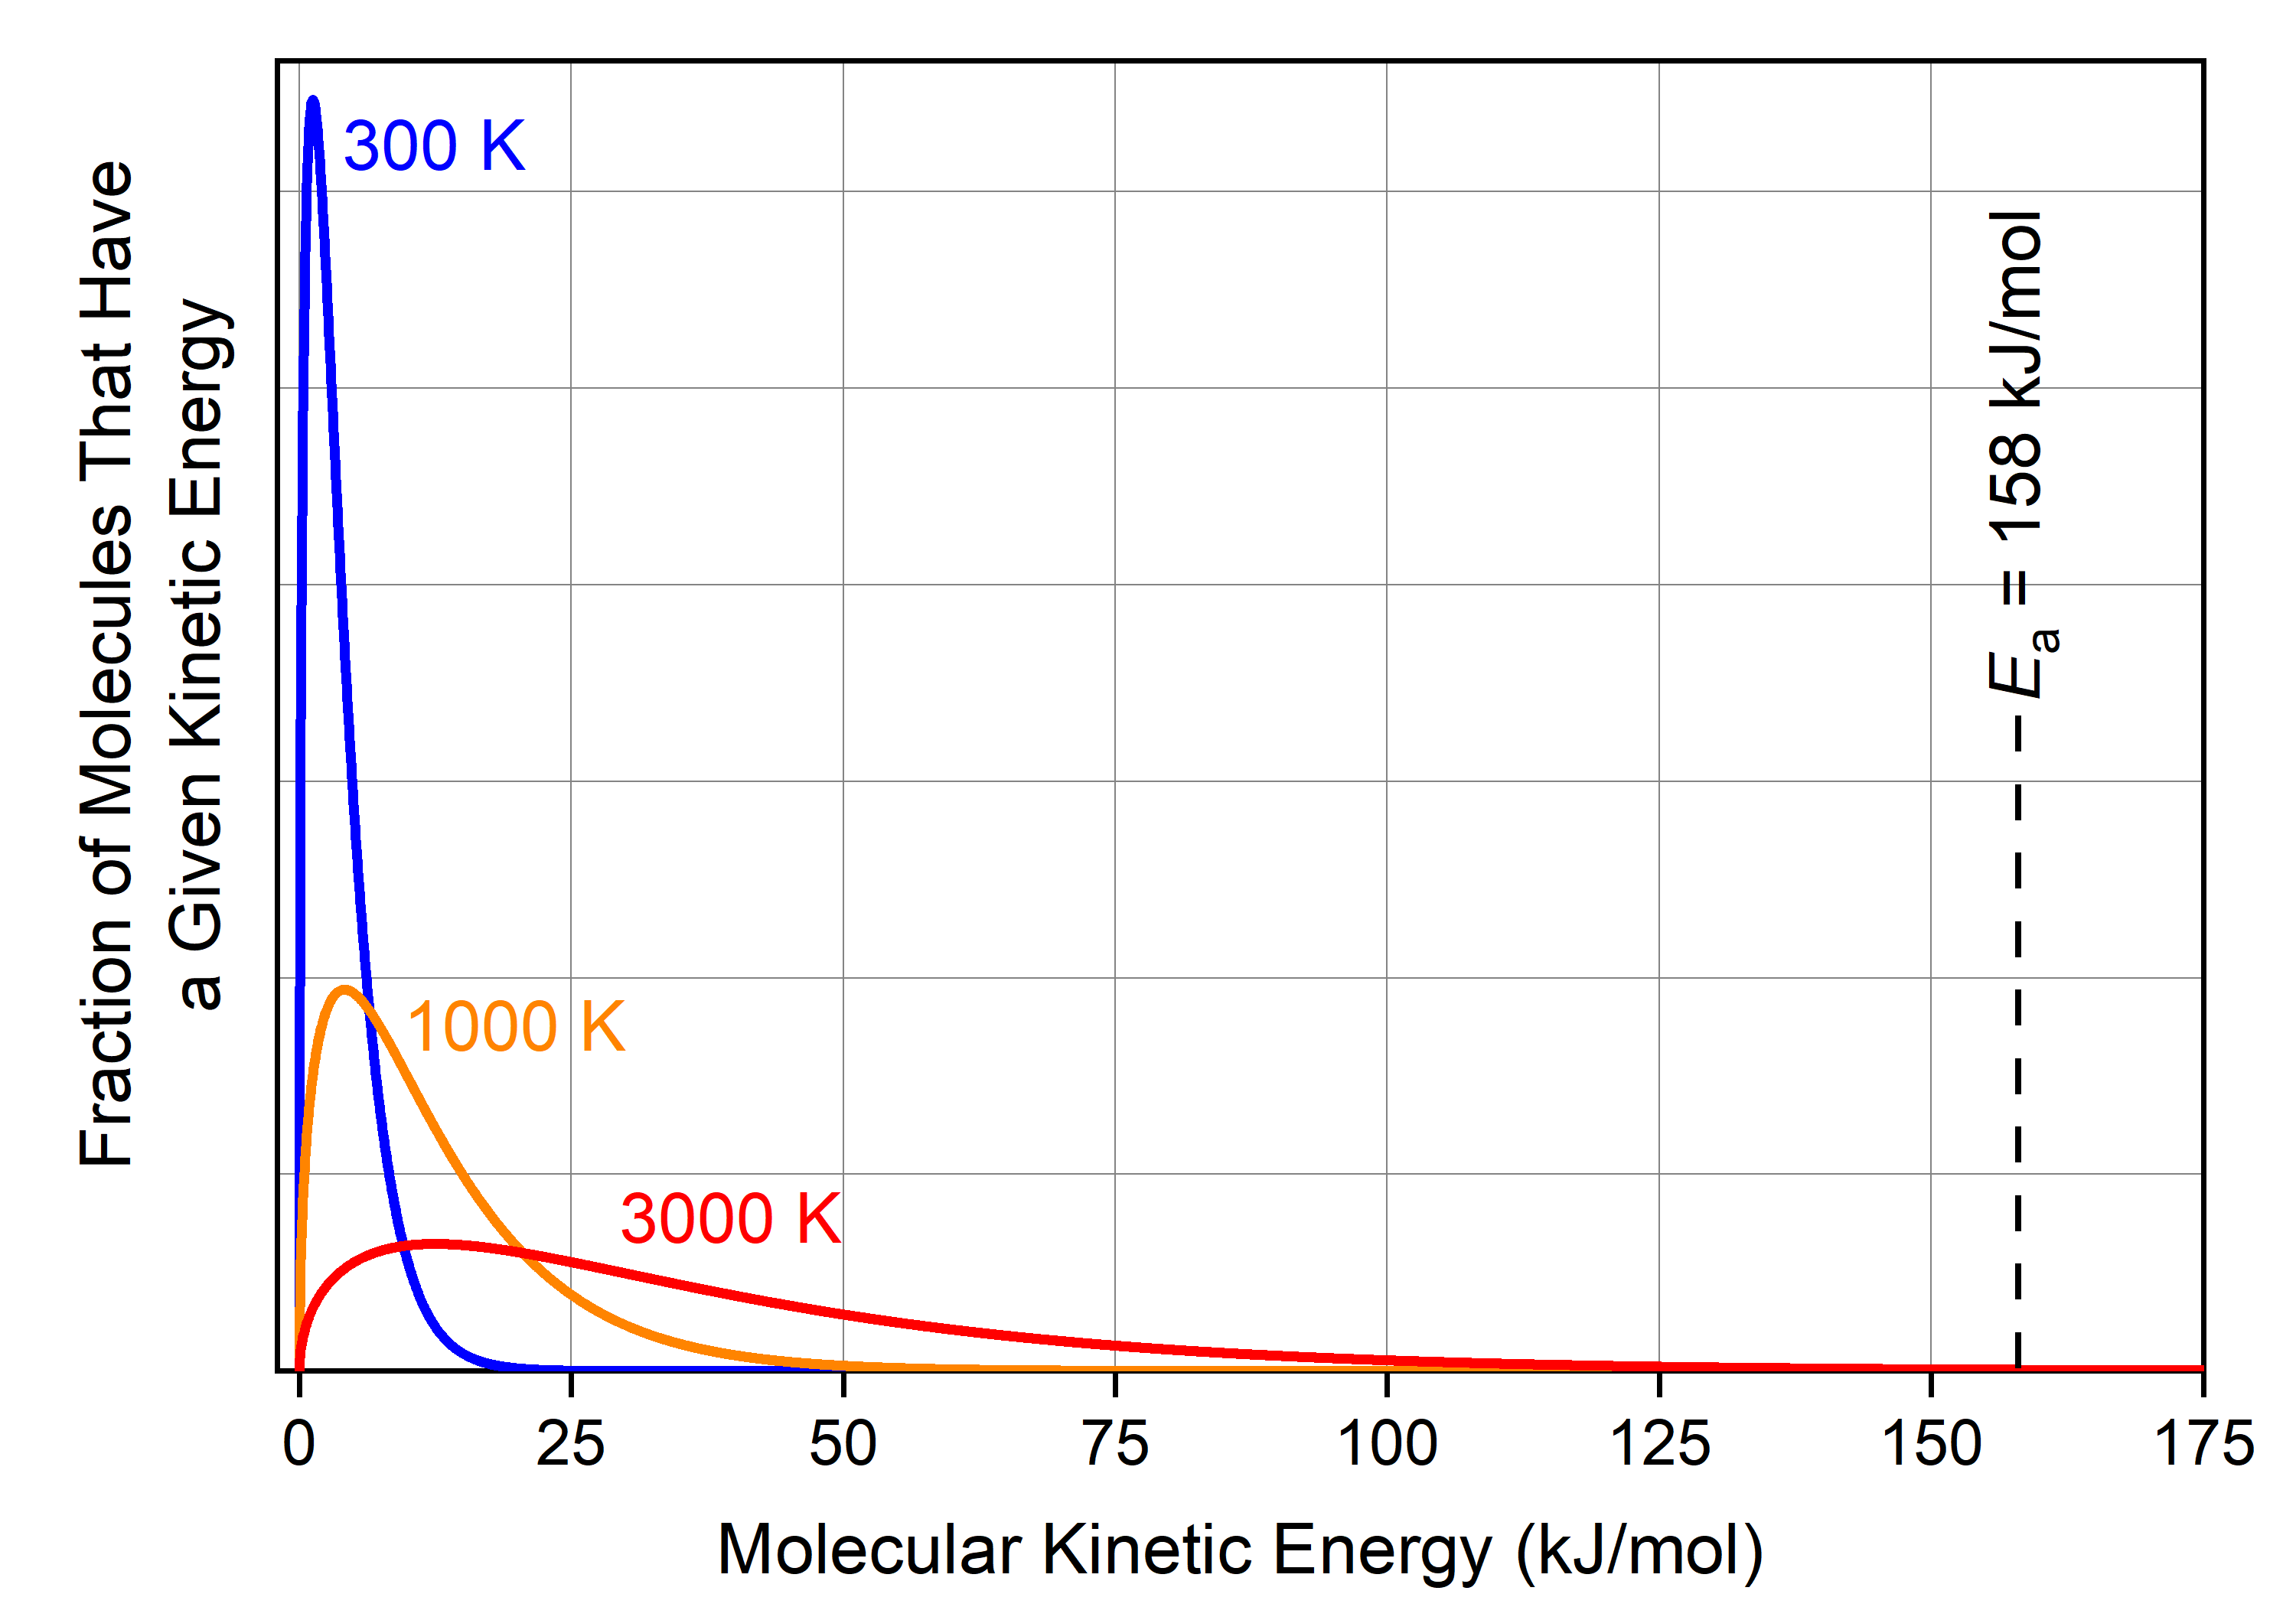
The fraction of cis-1,2-difluoroethene molecules with energy >158 kJ/mol at 300 K (blue curve) is minuscule: you need 35 kg of cis-1,2-difluoroethene to have 1 molecule that has KE > Ea. Although it may not be obvious from the graph, but there are significantly more molecules with sufficient energy at 1000 K (orange curve): namely, 2 × 10¹⁶ cis-1,2-difluoroethene molecules in a 1 mole (0.064 kg) sample have KE > Ea. (This is not obvious in the graph because this fraction of molecules represents 0.000003% of the total molecules.)
Therefore, there is essentially no cis-1,2-difluoroethene molecule with enough energy to reach the transition state at 300 K, and the reaction does not occur at this temperature (rate = 0; the time needed for a sample of cis-1,2-difluoroethene to reach equilibrium with trans-1,2-difluoroethene is hundreds of millions of years).
In comparison, at 1000 K, a small fraction of molecules is moving very fast. If such a rapidly moving molecule hits another molecule in a way that causes one carbon to start rotating with respect to the other carbon, and if the collision is hard enough such that the molecule now has energy greater than Ea, then the cis isomer can transform into the trans isomer.
Although the fraction of molecules with KE > Ea is small, remember that the molecules are constantly colliding and exchanging energy with each other. If you can follow a specific molecule over time, you will see its kinetic energy continually changing, and occasionally, it will be part of the fraction with KE > Ea. This is true for all the molecules within the sample of cis-1,2-difluoroethene at 1000 K. Moreover, molecules are moving faster on average at 1000 K than at 300 K (KEavg is greater). This leads to more frequent collisions and more frequent exchanges of energies. Therefore, the reaction rate is significantly faster at 1000 K, and equilibrium can be reached on the order of seconds.
Quantitatively, the rate constant, k, of a given reaction is proportional to the fraction of molecules with sufficient energy and that fraction involves an exponential:
Here, R is again the ideal gas constant (8.314 J/K·mol), T is absolute temperature (in kelvins), and Ea is expressed in J/mol; hence units in the exponent cancel. This proportionality relationship tells us that k is larger (rate is faster) when Ea is smaller as well as when T is larger. Hence, increasing the temperature of a reaction has a similar effect on the rate of the reaction as lowering the reaction’s activation energy.
Please use this form to report any inconsistencies, errors, or other things you would like to change about this page. We appreciate your comments. 🙂
