D24.4 pH and pOH

The concentrations of H3O+ and OH in a solution are important for the solution’s acid-base properties and often affect the chemical behaviors of other solutes. A solution is neutral if its [H3O+] = [OH]; acidic if its [H3O+] > [OH]; and basic if its [H3O+] < [OH].

A common means of expressing values that span many orders of magnitude is to use a logarithmic scale. One such scale is based on the p-function:

pX = -logX

where “X” is the quantity of interest and “log” is the base-10 logarithm. The pH of a solution is therefore defined as:

 \text{pH}\; =\; -\text{log}\left(\dfrac{[\text{H}_3\text{O}^+]}{mol/L}\right)

The reason for dividing by the units “mol/L” (M) is that [H3O+] has units of mol/L and taking the logarithm of a unit makes no sense. From here on we will assume that you are aware that only the numeric value of a concentration (or other quantity) needs to be used as the argument of a logarithm and we will not explicitly divide by the units.

If a pH value is known, the concentration of hydronium ions can be calculated:

[H3O+] = 10-pH

Here we assume that you know that units are required for the concentration obtained from this equation and the units are mol/L.

The hydroxide ion concentration may be similarly expressed as pOH:

pOH = -log[OH]          and          [OH] = 10−pOH

Finally, the relation between pH and pOH can be derived from the Kw expression:

Kw = [H3O+][OH]
-log(Kw) = -log([H3O+][OH])
pKw = -log([H3O+]) + (-log([OH]))
pKw = pH + pOH

At 25 °C:

pKw = 14.00 = pH + pOH

Therefore, at this temperature:

Classification Relative Ion Concentrations pH at 25 °C
acidic [H3O+] > [OH] < 7
neutral [H3O+] = [OH] 7
basic [H3O+] < [OH] > 7

Because Kw is temperature dependent, the correlations between pH values and the acidic/neutral/basic adjectives varies at different temperatures. For example, [H3O+] in pure water at 80 °C is 4.9 × 10⁻⁷ M, which corresponds to pH and pOH values of:

pH = -log[H3O+] = -log(4.9 × 10⁻⁷) = 6.31
pOH = -log[OH] = -log(4.9 × 10⁻⁷) = 6.31

At this temperature, neutral solutions have pH = pOH = 6.31, acidic solutions have pH < 6.31 and pOH > 6.31, and basic solutions have pH > 6.31 and pOH < 6.31. This distinction can be important when studying certain processes that occur at temperatures other than 25 °C, such as acid-base reactions in the human body where temperatures are typically 37 °C.

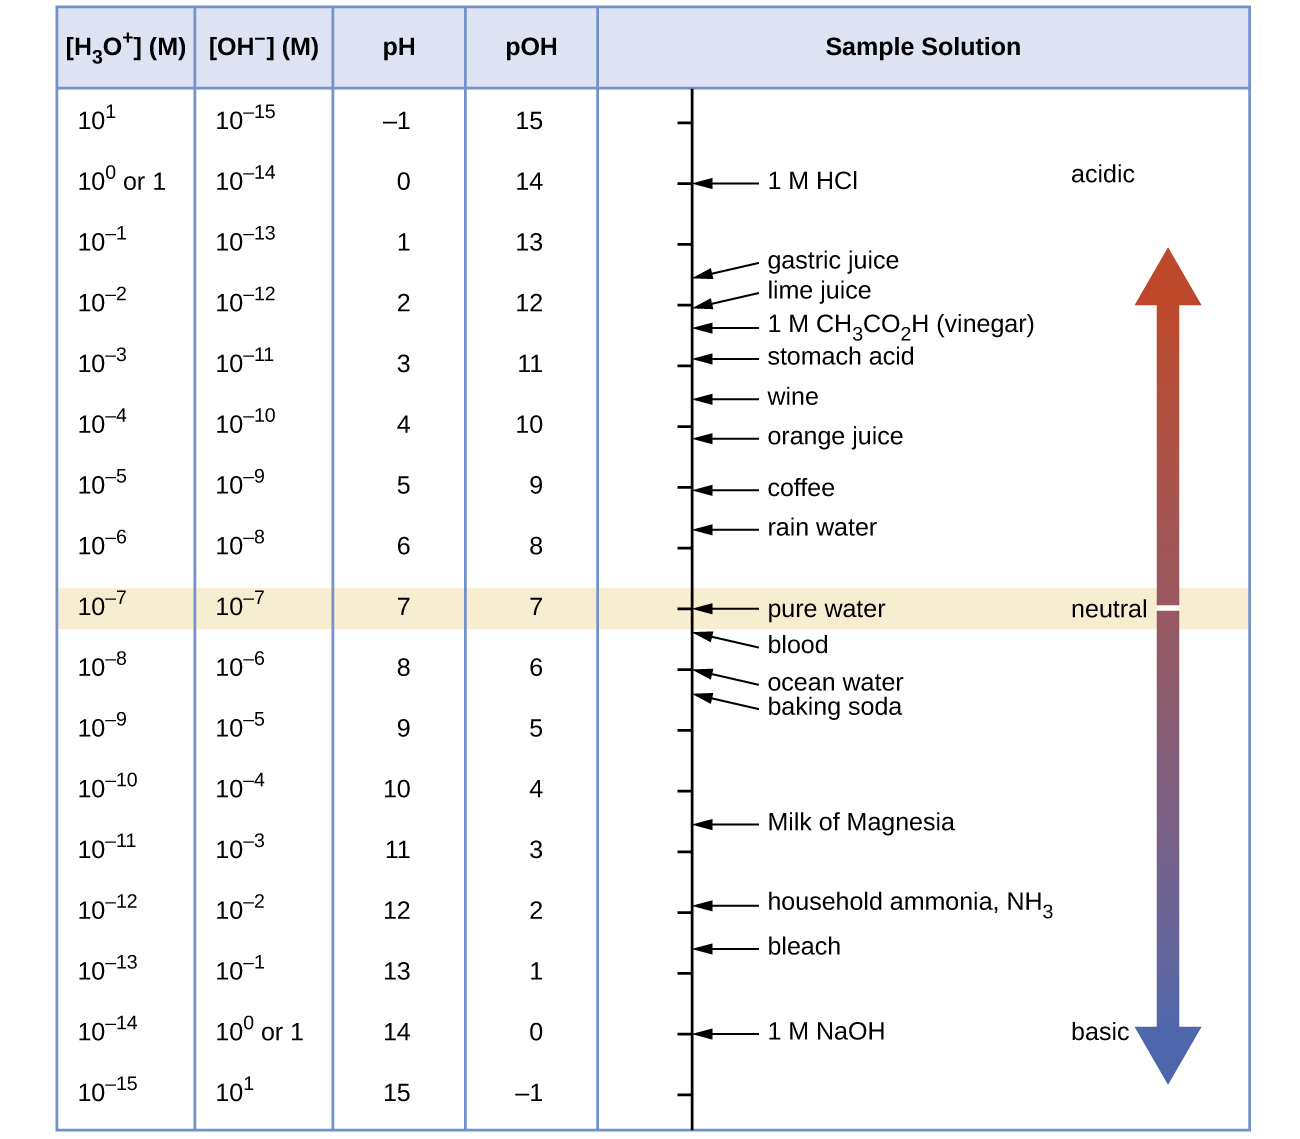
Unless otherwise noted, references to pH values are presumed to be those at 25 °C. The table below shows the relationships among [H3O+], [OH], pH, and pOH, and gives these values for some common substances.

A table is provided with 5 columns. The first column is labeled “left bracket H subscript 3 O superscript plus right bracket (M).” Powers of ten are listed in the column beginning at 10 superscript 1, including 10 superscript 0 or 1, 10 superscript negative 1, decreasing by single powers of 10 to 10 superscript negative 15. The second column is labeled “left bracket O H superscript negative right bracket (M).” Powers of ten are listed in the column beginning at 10 superscript negative 15, increasing by single powers of 10 to including 10 superscript 0 or 1, and 10 superscript 1. The third column is labeled “p H.” Values listed in this column are integers beginning at negative 1, increasing by ones up to 14. The fourth column is labeled “p O H.” Values in this column are integers beginning at 15, decreasing by ones up to negative 1. The fifth column is labeled “Sample Solution.” A vertical line at the left of the column has tick marks corresponding to each p H level in the table. Substances are listed next to this line segment with line segments connecting them to the line to show approximate p H and p O H values. 1 M H C l is listed at a p H of 0. Gastric juices are listed at a p H of about 1.5. Lime juice is listed at a p H of about 2, followed by 1 M C H subscript 3 C O subscript 2 H, followed by stomach acid at a p H value of nearly 3. Wine is listed around 3.5. Coffee is listed just past 5. Pure water is listed at a p H of 7. Pure blood is just beyond 7. Milk of Magnesia is listed just past a p H of 10.5. Household ammonia is listed just before a pH of 12. 1 M N a O H is listed at a p H of 0. To the right of this labeled arrow is an arrow that points up and down through the height of the column. A beige strip passes through the table and to this double headed arrow at p H 7. To the left of the double headed arrow in this beige strip is the label “neutral.” A narrow beige strip runs through the arrow. Just above and below this region, the arrow is purple. It gradually turns to a bright red as it extends upward. At the top of the arrow, near the head of the arrow is the label “acidic.” Similarly, the lower region changes color from purple to blue moving to the bottom of the column. The head at this end of the arrow is labeled “basic.”

Activity: pH and Relative Strengths of Acids

Exercise: pH of Aqueous Solutions

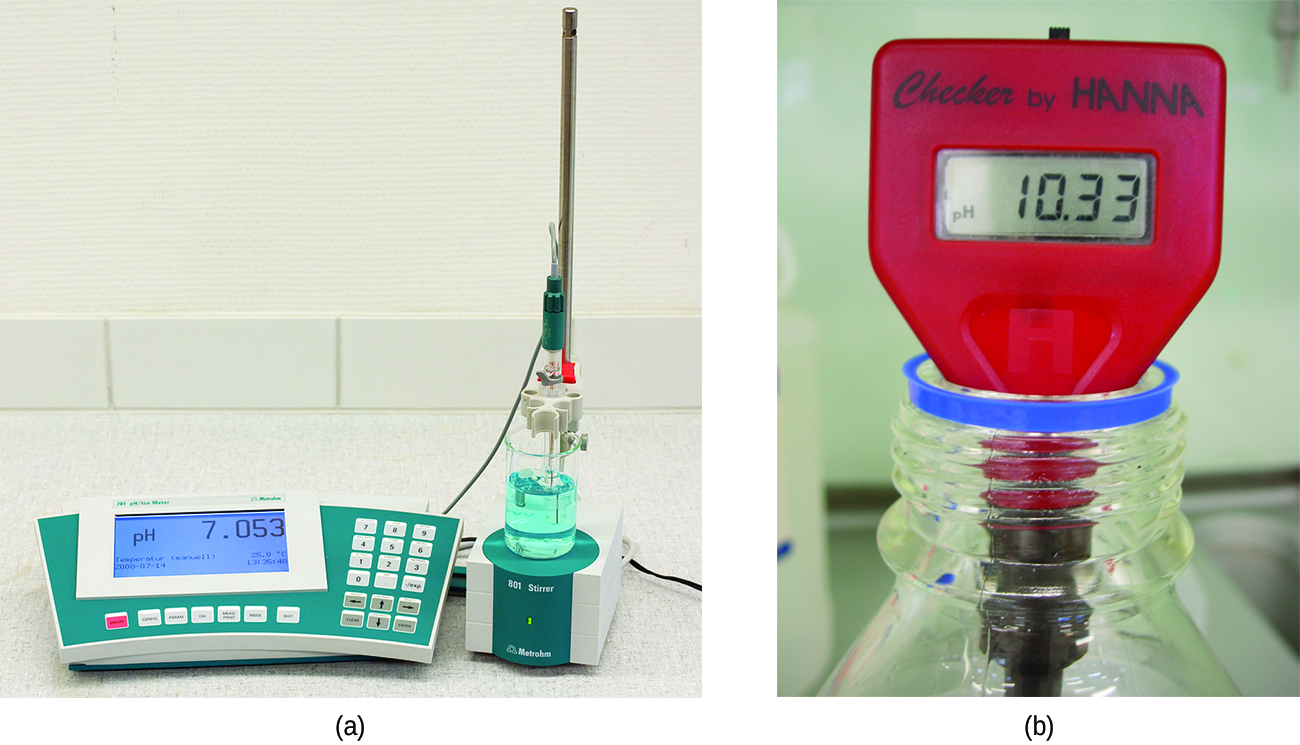
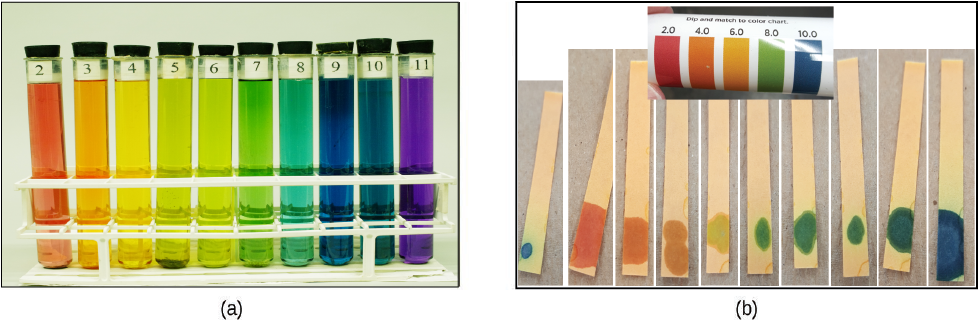
The acidity of a solution is typically determined by measuring its pH. The pOH of a solution is not usually measured, but it is easily calculated from an experimentally determined pH value. The pH of a solution can be directly measured using a pH meter or visually estimated using colored indicators.

This figure contains two images. The first, image a, is of an analytical digital p H meter on a laboratory counter. The second, image b, is of a portable hand held digital p H meter.
Figure: pH Meter. (a) A research-grade pH meter used in a laboratory can have a resolution of 0.001 pH units, an accuracy of ± 0.002 pH units, and may cost in excess of 1000 dollars. (b) A portable pH meter has lower resolution (0.01 pH units), lower accuracy (± 0.2 pH units), and a far lower price tag. (credit b: modification of work by Jacopo Werther)
This figure contains two images. Image a shows a variety of colors of solutions in labeled test tubes labeled with p H values from 2 to 11. p H 2 is dark orange. p H 3 is lighter orange. p H 4 is yellow. p H 5 is yellow green. p H 6 is pale green. p H 7 is darker green. p H 8 is light blue green. p H 9 is dark blue. p H 10 is medium-density blue. p H 11 is purple. Image b shows a color scale for paper that is used for measuring p H in the range from 2 to 10. Colors are p H 2, red-orange; p H 4 orange; p H 6 pale orange; p H 8 green; and p H 10 blue. (These are different from the colors in the test tubes.) Several test strips that have been moistened with a drop of solution to evaluate the solution's p H are also shown; these range in color from red-orange to blue.
Figure: pH Indicators. A universal indicator is a mixture of indicators that assumes a different color at different pH values. (a) A universal indicator has been added to solutions in ten test tubes, each with the pH shown at the top of each tube. (b) pH paper contains a different universal indicator that gives different colors when moistened with solutions of differing pH values. The scale at the top shows colors for even-numbered pH values from 2 to 10.

Activity: Determining Ka

Activity: Using Ka to Calculate Concentrations

The percent ionization of a weak acid is another measure of the strength of an acid, HA:

 \text{percent ionization} = \dfrac{[\text{H}_3\text{O}^{+}]_e}{[\text{HA}]_0}\;\times\;100\%

A stronger acid, with a larger Ka, has higher percent ionization than a weaker acid (for the same concentration). The percent ionization for a solution of a weak acid is concentration dependent: it increases with decreasing acid concentration.

Exercise 4: Percent Ionization

Comments
Please use this form to report any inconsistencies, errors, or other things you would like to change about this page. We appreciate your comments. 🙂

License

Icon for the Creative Commons Attribution-NonCommercial-ShareAlike 4.0 International License

Chemistry 109 Fall 2021 Copyright © by John Moore; Jia Zhou; and Etienne Garand is licensed under a Creative Commons Attribution-NonCommercial-ShareAlike 4.0 International License, except where otherwise noted.