D2.2 Atomic Spectra

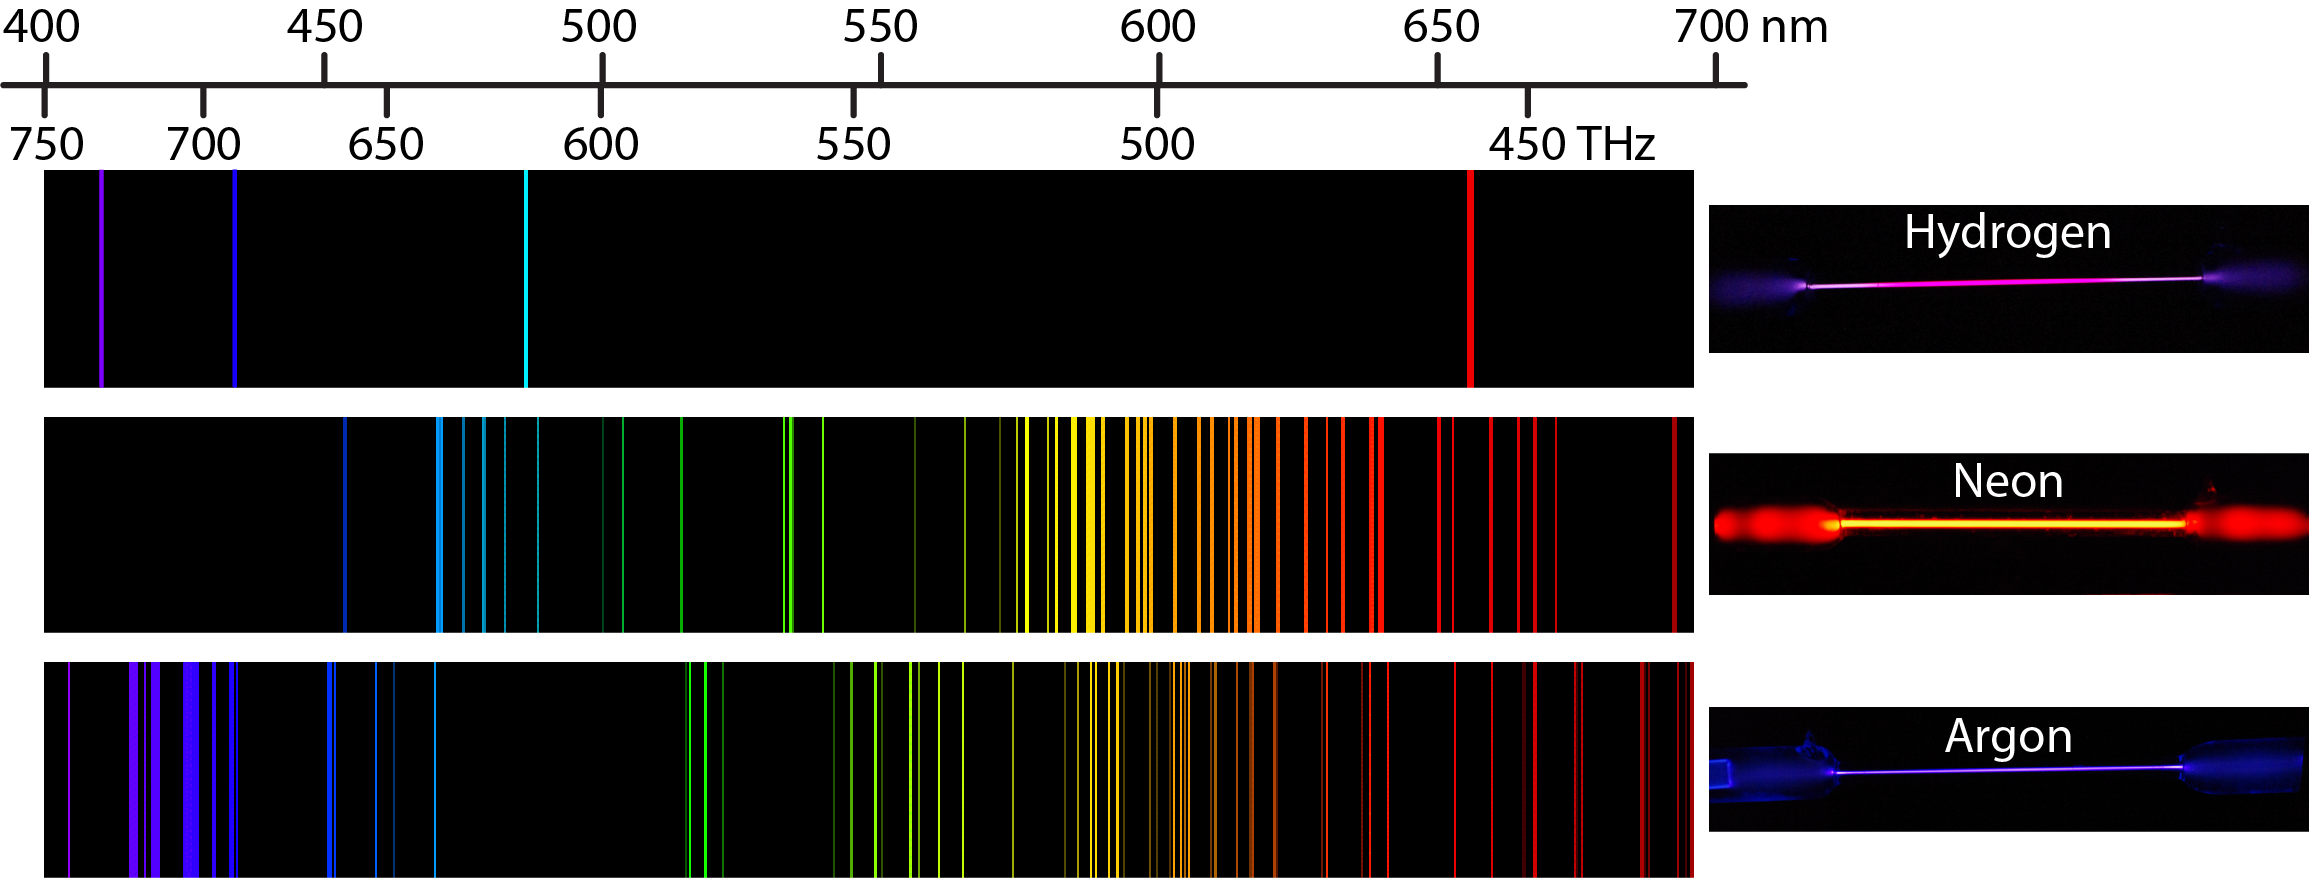
Heating a gaseous element at low pressure or passing an electric current through the gas imparts additional energy into the atoms. These higher energy atoms can then release the additional energy by emitting photons. For instance, the colors of “neon” signs are produced by passing electric current through low-pressure gases. Interestingly, the photons emitted by the higher-energy atoms have only a few specific energies, thereby producing a line spectrum consisting of very sharp peaks (lines) at a few specific frequencies. Line spectra were intriguing because there was no reason to expect that some frequencies would be preferred over others.

Each element displays its own characteristic set of lines. For example, when electricity passes through a tube containing H2 gas at low pressure, the H2 molecules are broken apart into separate H atoms and the H atoms emit a purple color. Passing the purple light through a prism produces the uppermost line spectrum shown in the figure: the purple color consists of four discrete visible wavelengths: 656.4 nm, 486.2 nm, 434.1 nm, and 410.2 nm.

An image is shown with 3 rows. Across the top is a scale that begins at 400nm at the left and extends to 700nm to the right. The top row shows the emission spectrum for hydrogen. This spectrum shows single bands in the violet, indigo, blue, and orange regions. There is a hydrogen discharge lamp on the right showing the overall purple color. The second row shows the emission spectrum for neon. This spectrum shows many band in the visible spectrum, from blue to red, with a greater concentration of bands in the red and orange region. There is a neon discharge lamp on the right showing the overall orange color. The third row shows the emission spectrum for argon. This spectrum shows many bands in the visible spectrum, from indigo to red, with a greater concentration of bands in the blue and indigo region. There is an argon discharge lamp on the right showing the overall violet color. It is important to note that each of the color bands for the emission spectra of the elements matches to a specific wavelength of light. Extending a vertical line from the bands to the scale above or below the diagram will match the band to a specific measurement on the scale.
Figure: Line Spectra. The line spectra of excited hydrogen, neon, and argon atoms; the photon wavelength and frequency scales are shown on top. The colors of the discharge lamps are shown on the right. (Spectra used with permission from Prof. Alan Jircitano’s website. Photos by James Maynard.)

The H-atom emission spectrum also contains lines in the ultraviolet and infrared ranges. In 1888, Johannes Rydberg developed an equation that predicts wavelengths for all hydrogen emission lines:

 \dfrac{1}{\lambda} = R_\infty \left( \dfrac{1}{n_2^2} - \dfrac{1}{n_1^2} \right)

Here, n1 and n2 are positive integers with n2 < n1, and the Rydberg constant R = 1.09737316 × 10⁷ m−1.

Because the wavelengths of hydrogen emission lines were measured to very high accuracy, the Rydberg constant could be determined very precisely. That a simple formula involving integers could account for such precise measurements seemed astounding at the time.

Exercise: Hydrogen-Atom Emission

Comments
Please use this form to report any inconsistencies, errors, or other things you would like to change about this page. We appreciate your comments. 🙂

License

Icon for the Creative Commons Attribution-NonCommercial-ShareAlike 4.0 International License

Chemistry 109 Fall 2021 Copyright © by John Moore; Jia Zhou; and Etienne Garand is licensed under a Creative Commons Attribution-NonCommercial-ShareAlike 4.0 International License, except where otherwise noted.