
D23.4 Gibbs Free Energy and Reaction Quotient
The relationship between Gibbs free energy, Q, and K is illustrated graphically in the figure below. The x-axis is the reaction mixture, which varies from containing only reactants (far left, Q = 0) to containing only products (far right Q = ∞). The y-axis is the Gibbs free energy, and Δy between two points on the plot corresponds to ΔrG (change in Gibbs free energy at nonstandard state). The Δy between the two ends of the plot (∑ΔfG°(products) − ∑ΔfG°(reactants)) corresponds to ΔrG°. (Technically, these plots need not pertain to starting and final conditions at standard state, which is what would make (GQ=∞ – GQ=0) = ΔrG°. However, for any given starting conditions, the sign of (GQ=∞ – GQ=0) will be equal to the sign of ΔrG°, allowing us to continue this level of comparison and qualitative analysis.)
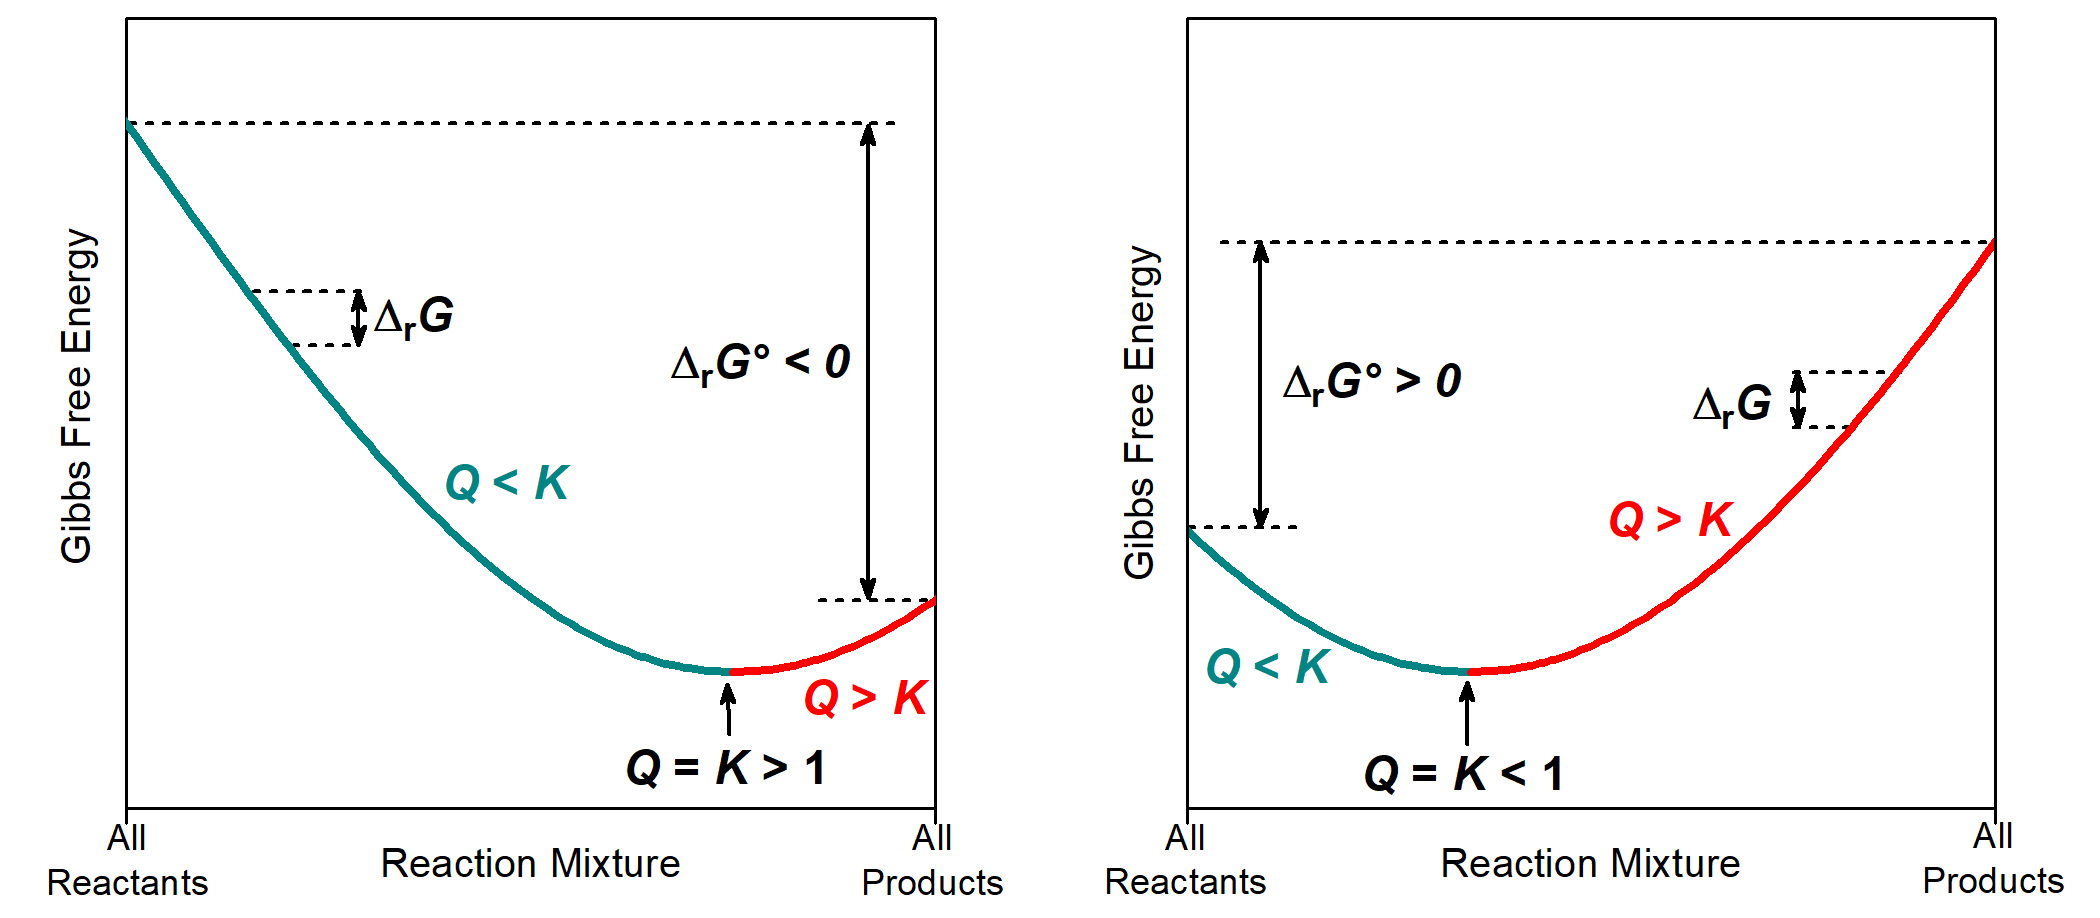
The part of the plot that is cyan corresponds to reaction mixtures where Q < K. If the reaction is proceeding forward (from reactants to products), then each incremental progress of the reaction has a negative ΔrG, which would predict spontaneous forward reaction.
The part of the plot that is red corresponds to reaction mixtures where Q > K. If the reaction is proceeding forward (from reactants to products), then each incremental progress of the reaction has a positive ΔrG, which would predict spontaneous reverse reaction.
At the very bottom of the plot (minimum Gibbs free energy) the system is at equilibrium with Q = K. Hence, we can think of such a plot as a Gibbs free energy valley. The reaction will spontaneously proceed in the direction corresponding to going down this valley, towards the equilibrium at the very bottom.
Where equilibrium lies along the x-axis depends on K° and the sign of ΔrG°. When K° > 1 and ΔrG° < 0, the equilibrium (minimum in the curve) is further to the right, indicating that there are more products than reactants in the equilibrium mixture. When K° < 1 and ΔrG° > 0, the equilibrium is further to the left, indicating that reactants predominate in the equilibrium mixture.
The Gibbs free energy change at any point along the reaction progress involves adjusting ΔrG° by the factor RT(lnQ):
At equilibrium, Q = K and ΔrG = 0, therefore:
And we again obtain the relationship:
Exercise: Gibbs Free Energy—Nonstandard Conditions
Please use this form to report any inconsistencies, errors, or other things you would like to change about this page. We appreciate your comments. 🙂
