
D22.4 Effect of Temperature on Equilibrium
Recall that:
Therefore:
This equation can be used to calculate K° at different temperatures, if we assume that ΔrH° and ΔrS° for a reaction have the same values at all temperatures. This is a good, but not perfect, assumption, and we will use it in this course unless specified otherwise. It is not a good assumption if there is a phase change for a reactant or a product within the temperature range of interest.
Dividing both sides of the equation by “-RT” gives:
| lnK° | = |  |
+ |  |
| y | = | mx | + | b |
A plot of lnK° vs.  is called a van’t Hoff plot. The graph has a slope of
  . Therefore, if the concentrations of reactants and products are measured at various temperatures so that K° can be calculated at each temperature, the reaction enthalpy change can be obtained from a van’t Hoff plot.
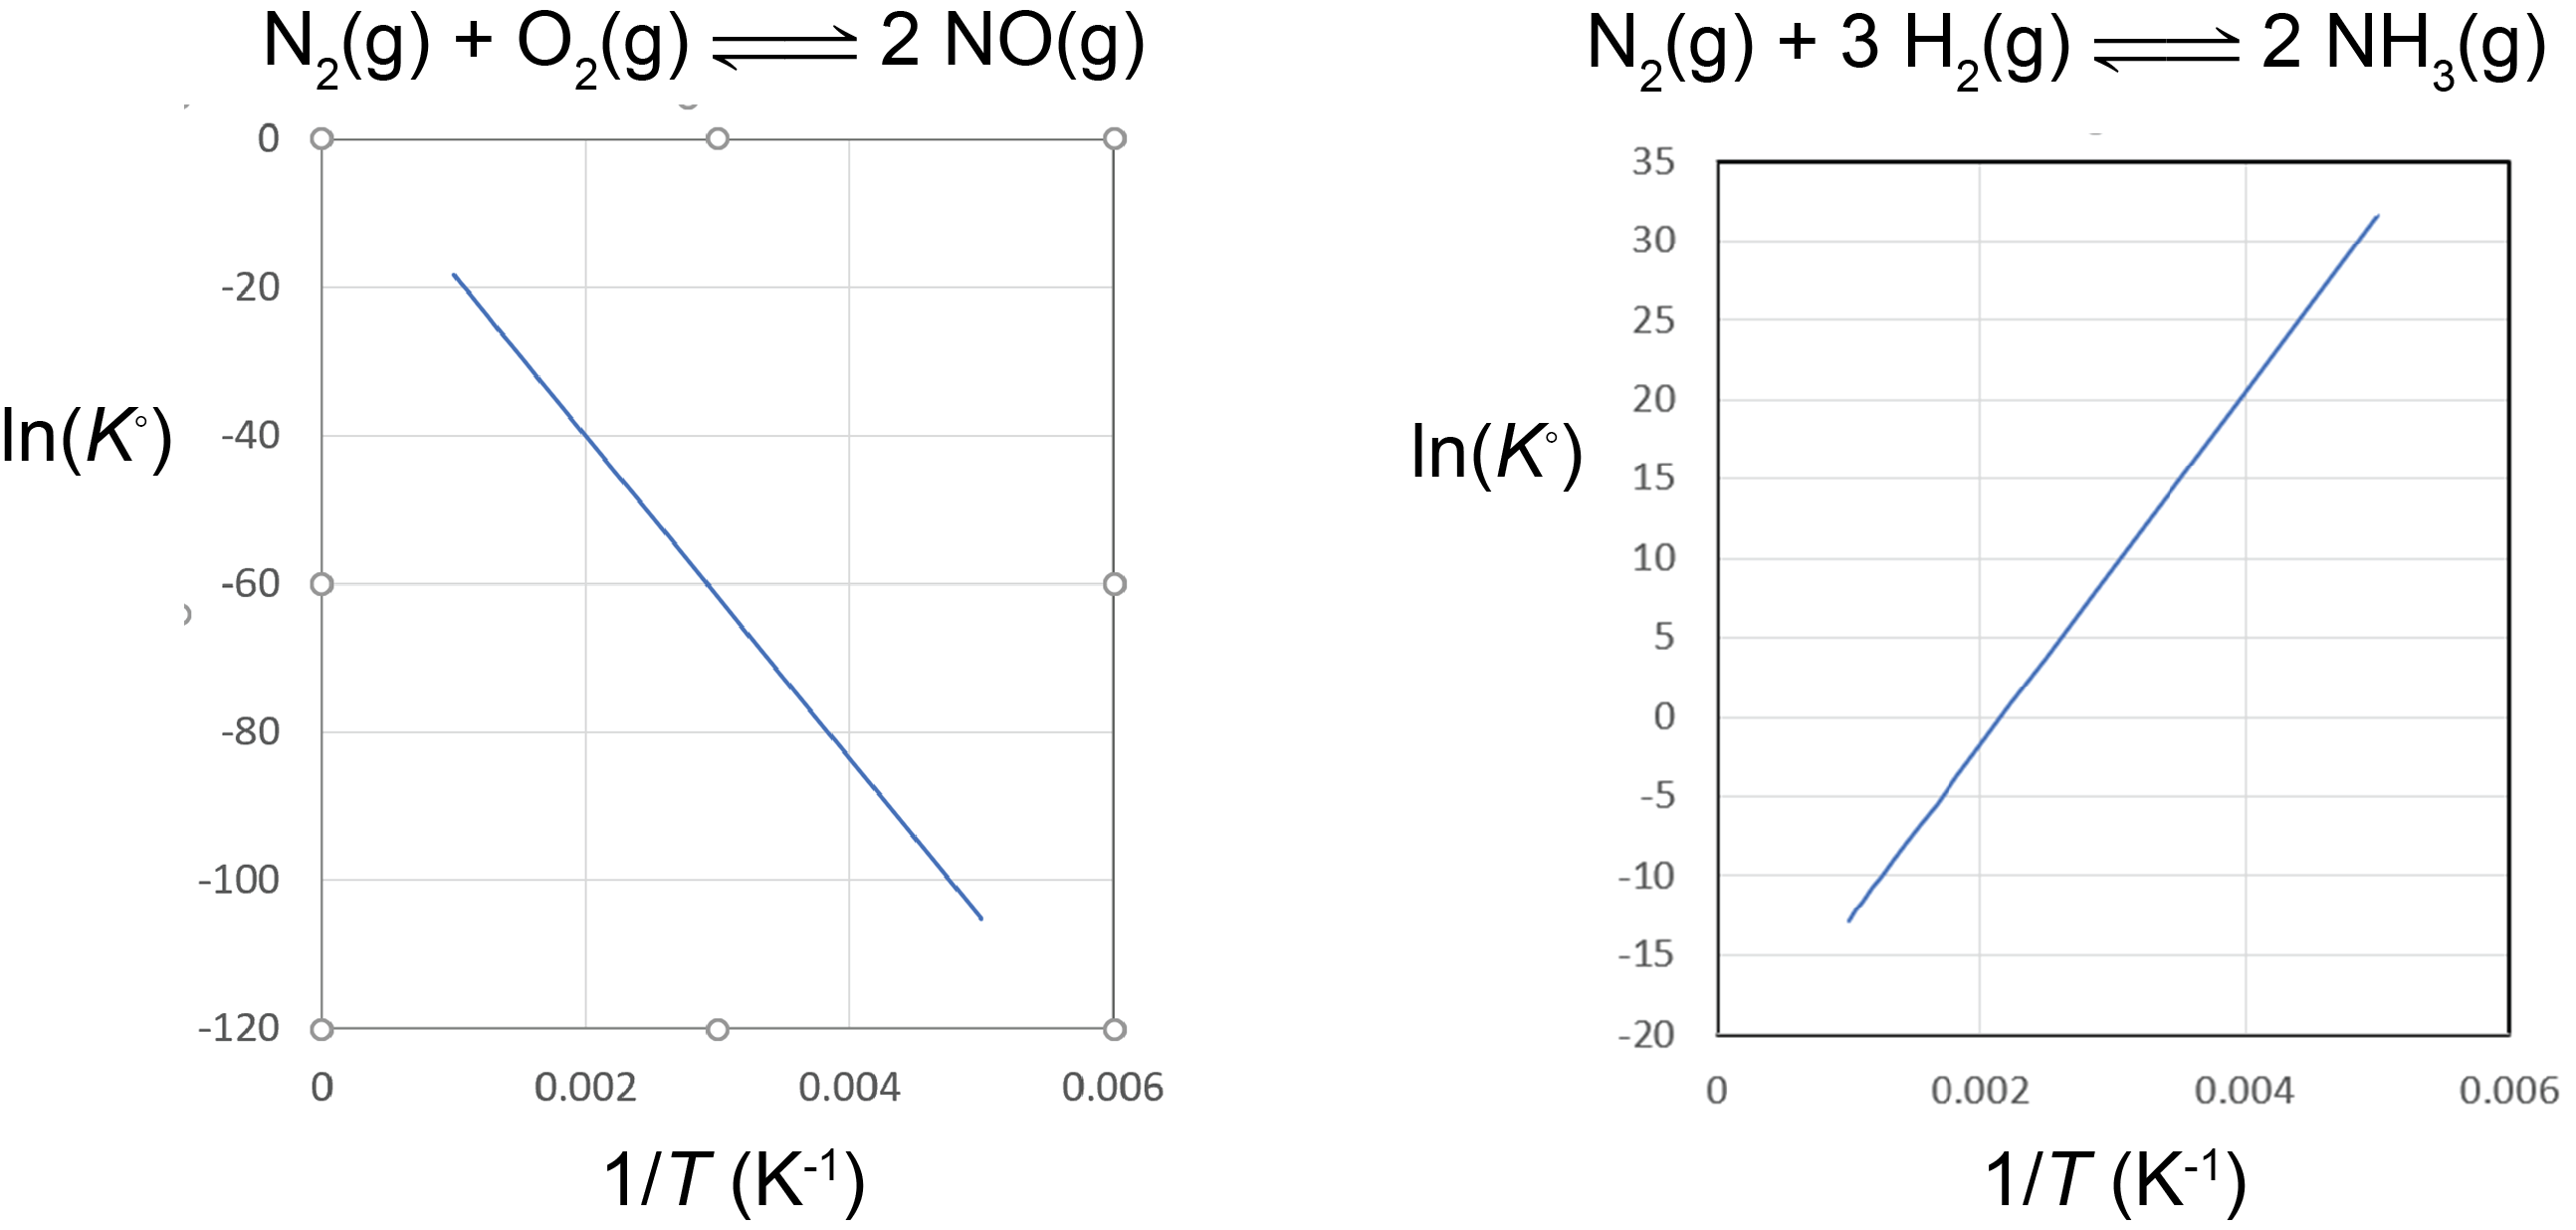
Based on the equation for the van’t Hoff plot, an exothermic reaction (ΔrH° < 0) has K° decreasing with increasing temperature, and an endothermic reaction (ΔrH° > 0) has K° increasing with increasing temperature. This shows that the magnitude of ΔrH° will dictate how rapidly K° changes as a function of temperature.
For example, suppose that K°1 and K°2 are the equilibrium constants for a reaction at temperatures T1 and T2, respectively:


Subtracting the two equations yields:
![\begin{array}{rcl}\text{ln}K_2^{\circ}\;-\;\text{ln}K_1^{\circ} &=& \left(-\dfrac{{\Delta}_{\text{r}}H^{\circ}}{R}\left(\dfrac{1}{T_2}\right)\;+\;\dfrac{{\Delta}_{\text{r}}S^{\circ}}{R}\right) - \left(-\dfrac{{\Delta}_{\text{r}}H^{\circ}}{R}\left(\dfrac{1}{T_1}\right)\;+\;\dfrac{{\Delta}_{\text{r}}S^{\circ}}{R}\right)\\[1em] \text{ln}\left(\dfrac{K_2^{\circ}}{K_1^{\circ}}\right) &=& -\dfrac{{\Delta}_{\text{r}}H^{\circ}}{R}\left(\dfrac{1}{T_2}\;-\;\dfrac{1}{T_1}\right)\\[1em] \text{ln}\left(\dfrac{K_2^{\circ}}{K_1^{\circ}}\right) &=& \dfrac{{\Delta}_{\text{r}}H^{\circ}}{R}\left(\dfrac{1}{T_1}\;-\;\dfrac{1}{T_2}\right) \end{array}](https://wisc.pb.unizin.org/app/uploads/quicklatex/quicklatex.com-a546c4b9c44944d599ad9cc91b3ddb80_l3.png "Rendered by QuickLaTeX.com")
Thus calculating ΔrH° from tabulated ΔfH° values and measuring the equilibrium constant at one temperature would allow us to calculate the equilibrium constant at any other temperature (assuming that ΔrH° and ΔrS° are independent of temperature).
Exercise: Temperature Dependence of the Equilibrium Constant
Using this equation, you can also estimate ΔrH° without constructing a van’t Hoff plot if K° was determined at only two temperatures (but the result will not be as accurate).
Please use this form to report any inconsistencies, errors, or other things you would like to change about this page. We appreciate your comments. 🙂
