
D17.1 Energy and Phase Change
Earlier we used boiling points of substances as a way to compare the strengths of attractive forces between molecules (London forces (LDFs), dipole-dipole forces, hydrogen bonds). We now explore that idea in more detail.
When a liquid boils, molecules become much farther apart in the gas phase than they were in the liquid phase. Because of intermolecular attractive forces, the energy of a pair of molecules is lower when the molecules are close together than when they are farther apart. For example, consider argon, which boils at 87.3 K (−185.8 °C). The figure in the activity below shows how the potential energy of two argon atoms varies with distance between their atomic nuclei.
Activity: Analysis of Potential Energy Curve for Argon
Now think about what happens when argon boils. In the gas phase, nearly all the molecules are much farther apart than 800 pm, so the attractions between them are negligible. In the liquid phase, the molecules are 350–450 pm apart and almost every molecule is surrounded by many other molecules at distances less than 600 pm. Separating two molecules requires that the molecules have at least enough kinetic energy to go from −1.16 kJ/mol on the potential energy curve (distance of 377 pm) to 0 kJ/mol on the curve (distance of >800 pm). For a pair of molecules 377 pm apart, 1.16 kJ/mol (or 1.93 × 10⁻²⁴ kJ/molecule) is required to separate the molecules. At any given instant, each molecule in the liquid is surrounded by about a dozen other molecules at distances ranging between 350 and 450 pm. The situation is is more complicated than for just two molecules and the energy required is different: it takes 6.4 kJ/mol to vaporize a sample of liquid argon.
Chemists describe this situation by saying that there is an energy barrier, some minimum energy below which a process cannot occur. For the process of boiling, the energy barrier is the minimum energy required for a molecule in the liquid phase to escape from the attractions of the molecules surrounding it. In the case of argon, the energy barrier is the 6.4 kJ/mol difference in energy between molecules in the liquid and molecules in the gas phase. This difference is the result of attractive forces (London dispersion forces) that cause the energies of molecules that are close together in the liquid phase to be less than the energies of molecules that are far apart in the gas phase.
Distribution of Molecular Energies
Activity: Molecular Speeds in Argon Gas
As you can see from the simulation of argon gas, molecules are in constant motion. At a given instant, some molecules are moving fast and others are moving slowly. That is, there is a distribution of speeds of the molecules. Because kinetic energy is proportional to the square of molecular speed, there is also a distribution of molecular energies. More detailed analysis of the motions of gas molecules reveals which molecular energies are more likely than others. The distribution of molecular energies is represented by the curve in the figure below.
Activity: Distribution of Molecular Energies in Argon Gas
When a sample of liquid argon boils, bubbles of argon gas form within the liquid and rise to the surface. (The same applies to boiling water or any other liquid.) Consider a single argon atom that is in the liquid and is at the surface that separates liquid from gas. In both liquid and gas the energy of any individual molecule changes continually as a result of collisions with other molecules: sometimes the molecule’s energy is low, sometimes it is high. If the molecule’s energy is equal to or higher than 6.4 kJ/mol, the molecule has enough energy to overcome the attractions toward other molecules that surround it; if the molecule is at the surface of the liquid, then it can transfer from liquid phase to gas phase. The rate at which molecules escape from the liquid surface is greater the larger the fraction of molecules that have sufficient energy. That fraction depends on temperature, as shown in the figure below.
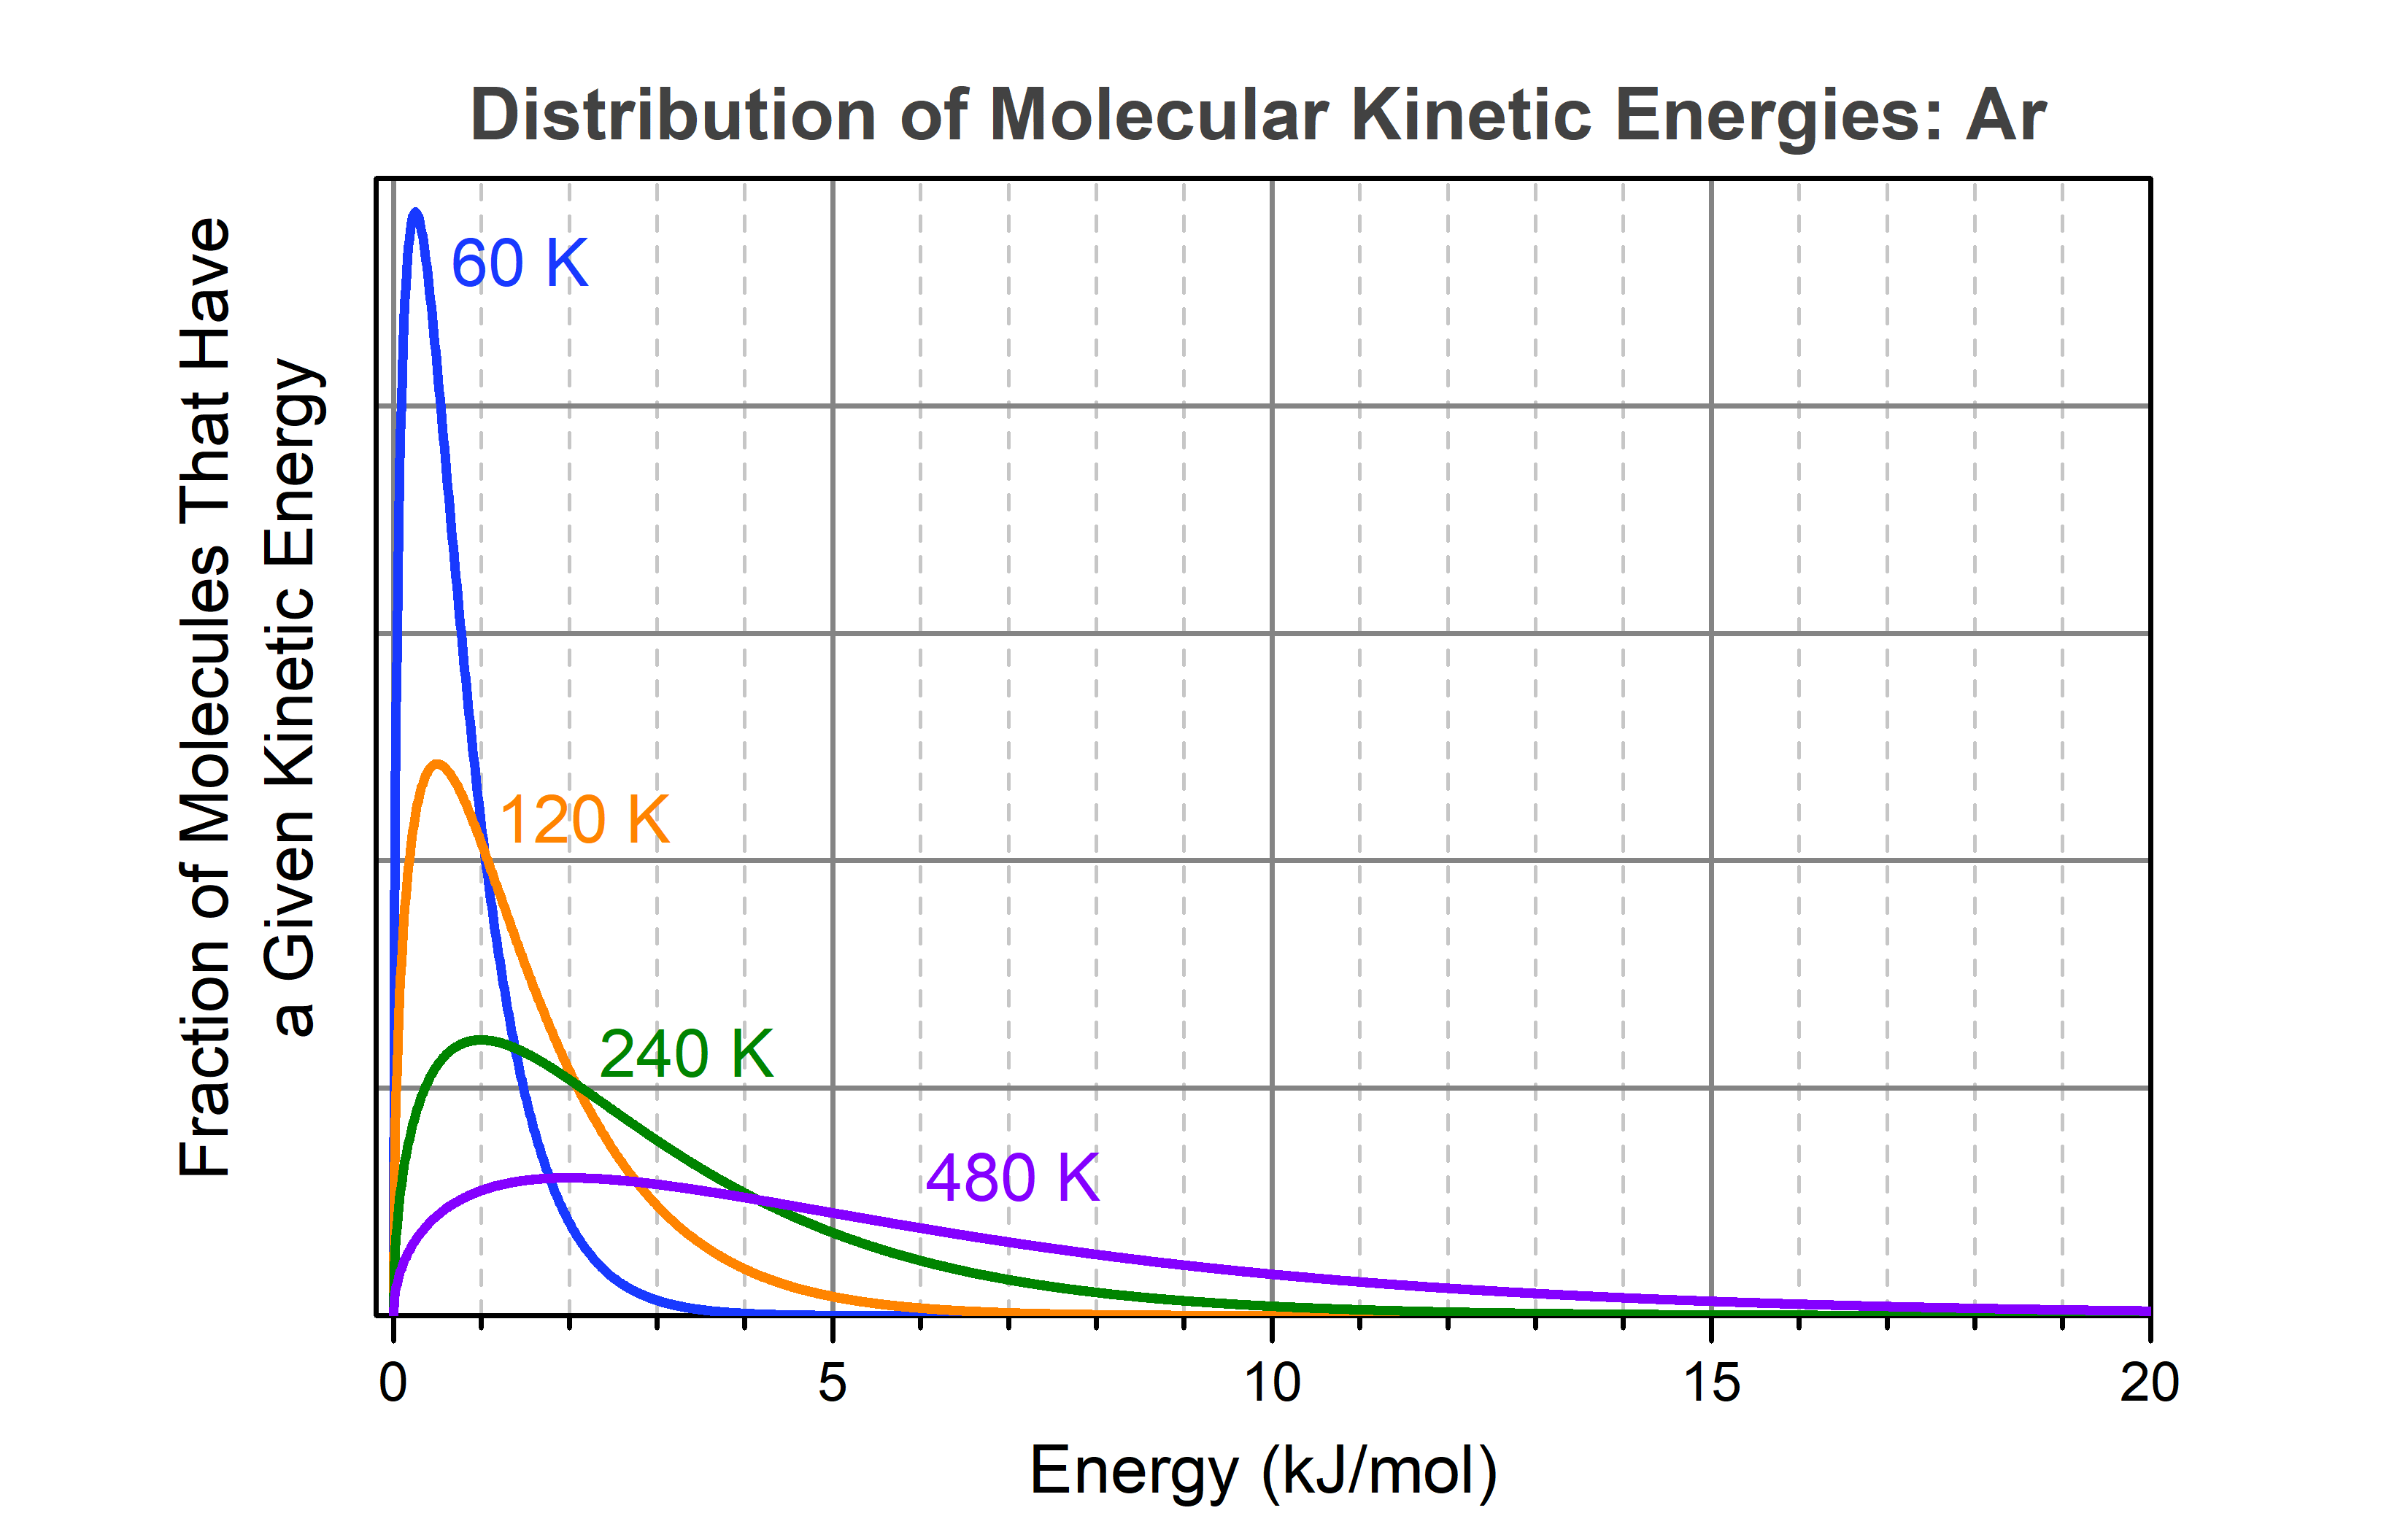
From the blue curve in the figure it is clear that at 60 K a very small fraction of molecules has energy greater than 6.4 kJ/mol. At 6.4 kJ/mol on the horizontal axis, the blue curve has almost reached zero. However, the blue curve approaches zero asymptotically: there is still a tiny fraction of molecules that has energy 6.4 kJ/mol or more. You cannot tell from the graph, but calculations show that the fraction of molecules with energy greater than 6.4 kJ/mol is about 105 times smaller than the fraction with energy greater than 0.25 kJ/mol (the maximum in the blue curve), but it is not zero. At 120 K (orange curve) the fraction of molecules with energy greater than 6.4 kJ/mol is significantly higher and the fraction gets larger quite rapidly as the temperature increases. Thus, raising the temperature greatly increases the fraction of molecules moving at high speeds.
Activity: Distribution of Molecular Energies at Different Temperatures
During our discussion of boiling argon, you may have thought, “How do they know that it takes 6.4 kJ/mol to separate argon molecules from liquid to gas phase?” Such information is obtained by thermodynamic measurements that involve instruments known as calorimeters. The next sections explore such measurements in more detail.
Please use this form to report any inconsistencies, errors, or other things you would like to change about this page. We appreciate your comments. 🙂
