D3.3 Orbital Energy Level Diagrams
An orbital energy level diagram (or just orbital diagram) shows the relative energies of orbitals and how electrons are distributed among orbitals within a subshell. In an orbital energy level diagram, individual orbitals are usually represented by horizontal lines whose vertical position conveys the qualitative relative energies of the orbitals. The electrons are represented as arrows with the direction of the arrow communicating the sign of ms (the ↑ arrow represents ms = +½ and the ↓ arrow represents ms = -½).
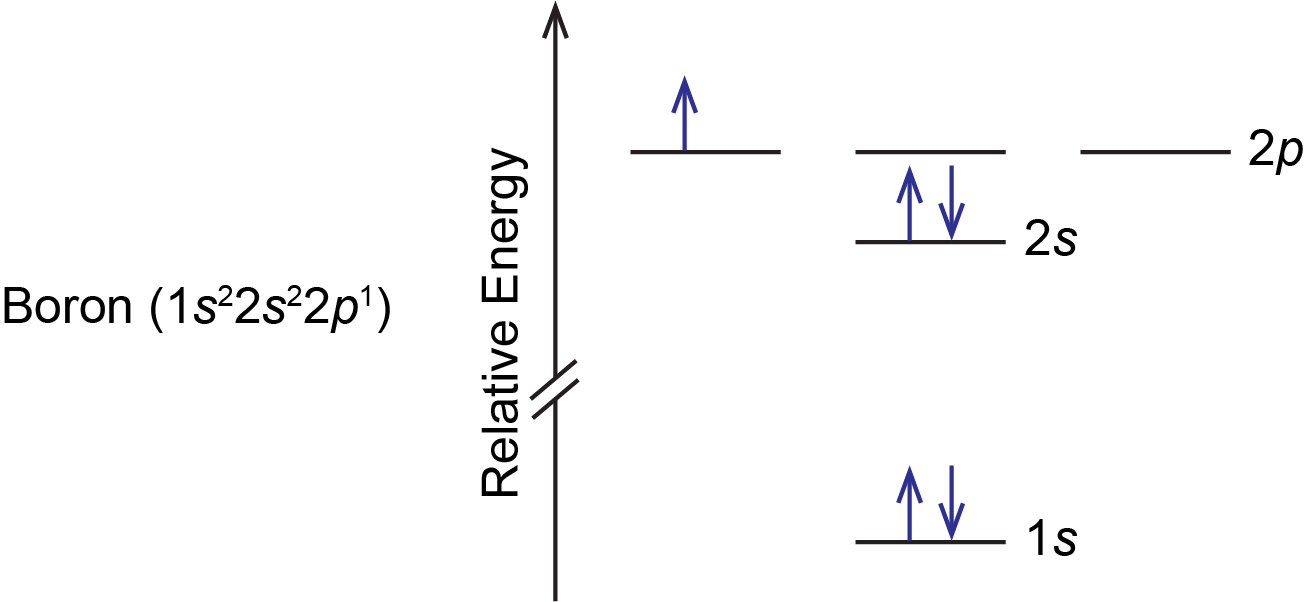
For example, a ground state boron atom has this orbital energy level diagram:

As illustrated by the boron example, an orbital diagram includes all orbitals in all subshells within a partially occupied shell, even if some orbitals are unoccupied. Note that the three 2p orbitals are degenerate, so the electron can occupy any one of them.
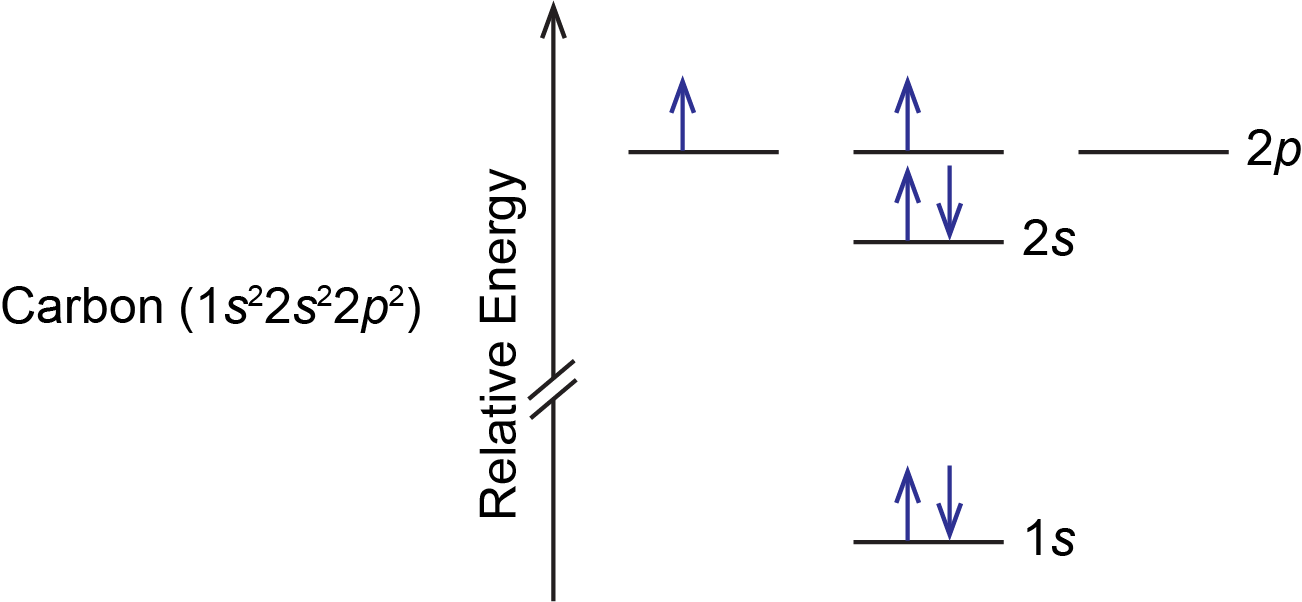
A carbon atom has six electrons, so there are two electrons in the 2p subshell. These two electrons could: (1) pair up in a single 2p orbital, or (2) occupy separate orbitals but with opposite spins, or (3) occupy separate orbitals but with parallel spins. All three possibilities are valid based on quantum numbers and Pauli exclusion principle, but only one is lowest in energy. According to Hund’s rule, the lowest energy configuration has the maximum number of unpaired electrons with parallel spin within a set of degenerate orbitals. This means that option (3) is lowest in energy and represents the ground state of a carbon atom; options (1) and (2) represent excited states. Therefore, the orbital diagram for the ground state of carbon is:

Exercise: Electron Repulsions and Unpaired Electrons
Please use this form to report any inconsistencies, errors, or other things you would like to change about this page. We appreciate your comments. 🙂

