Review: Photons
Blackbody Radiation
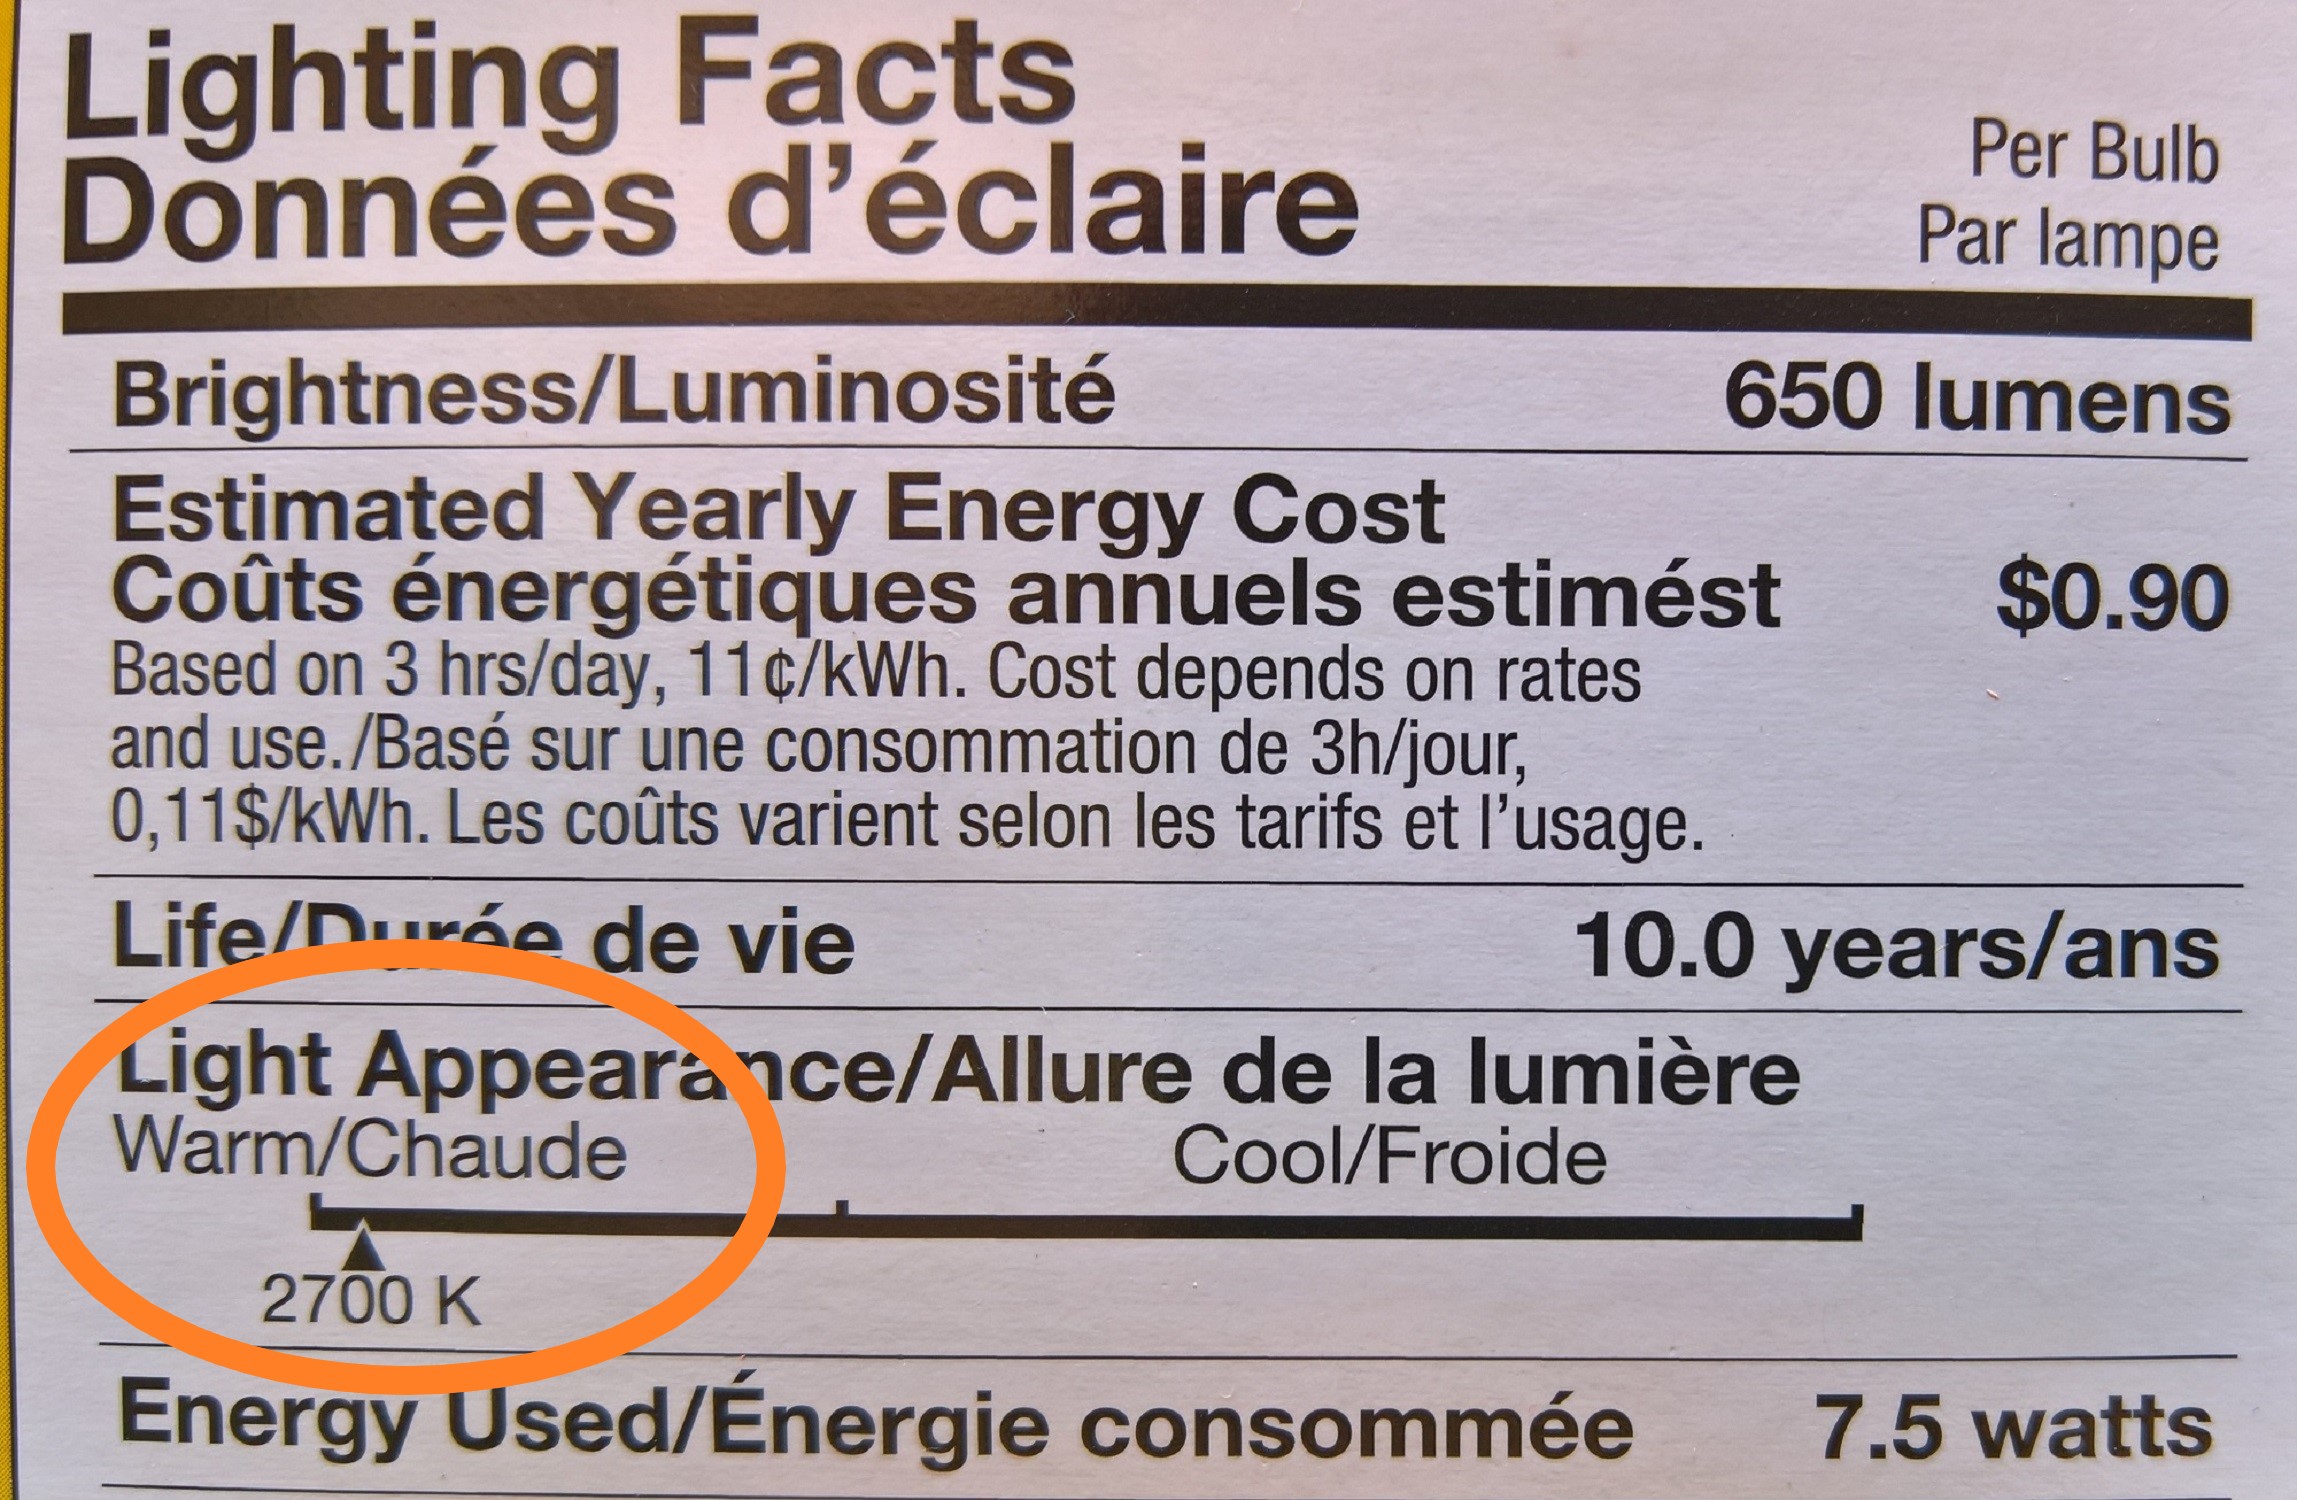
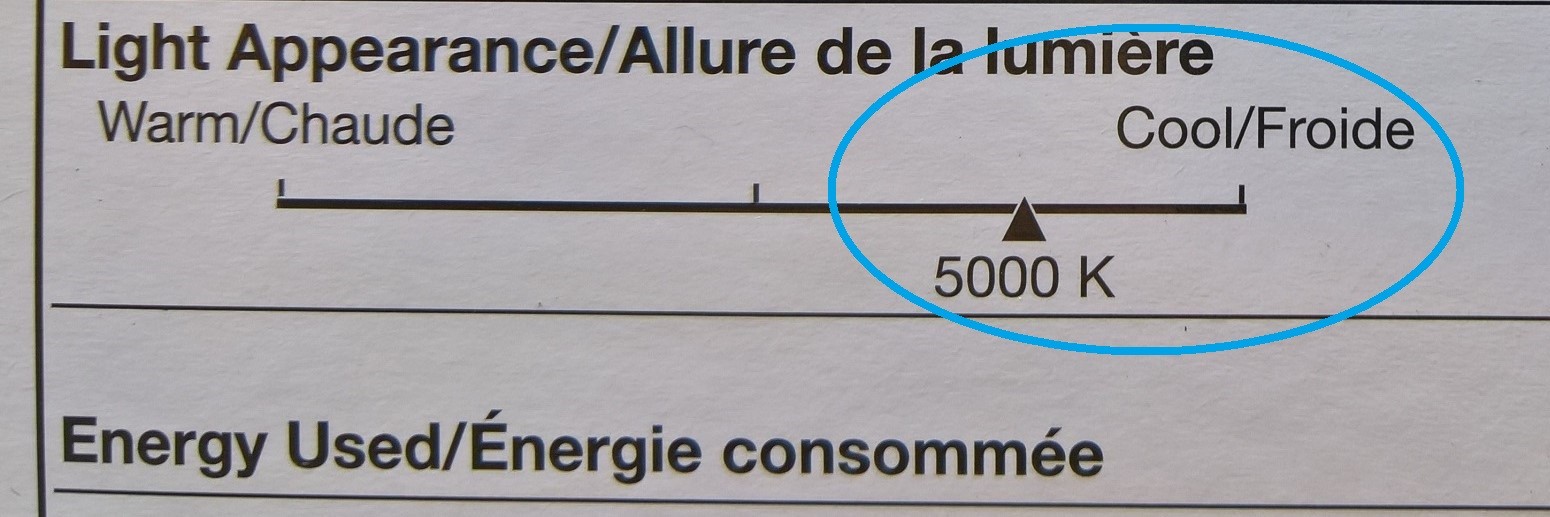
Have you noticed that some LED light bulbs are a different color from others? Some are “warm” and others are “cool” (see Figure 1). Candlelight is “warmer” (yellower) than fluorescent lights: the latter have a blue cast that can make people’s faces look sickly. These observations are related to blackbody radiation—the continuous spectrum of light emitted by matter as the matter is heated to higher temperatures.

 Figure 1. Labels from LED light bulb boxes. Notice that the “warm” bulb is labeled 2700 K while the “cool” bulb is labeled 5000 K.
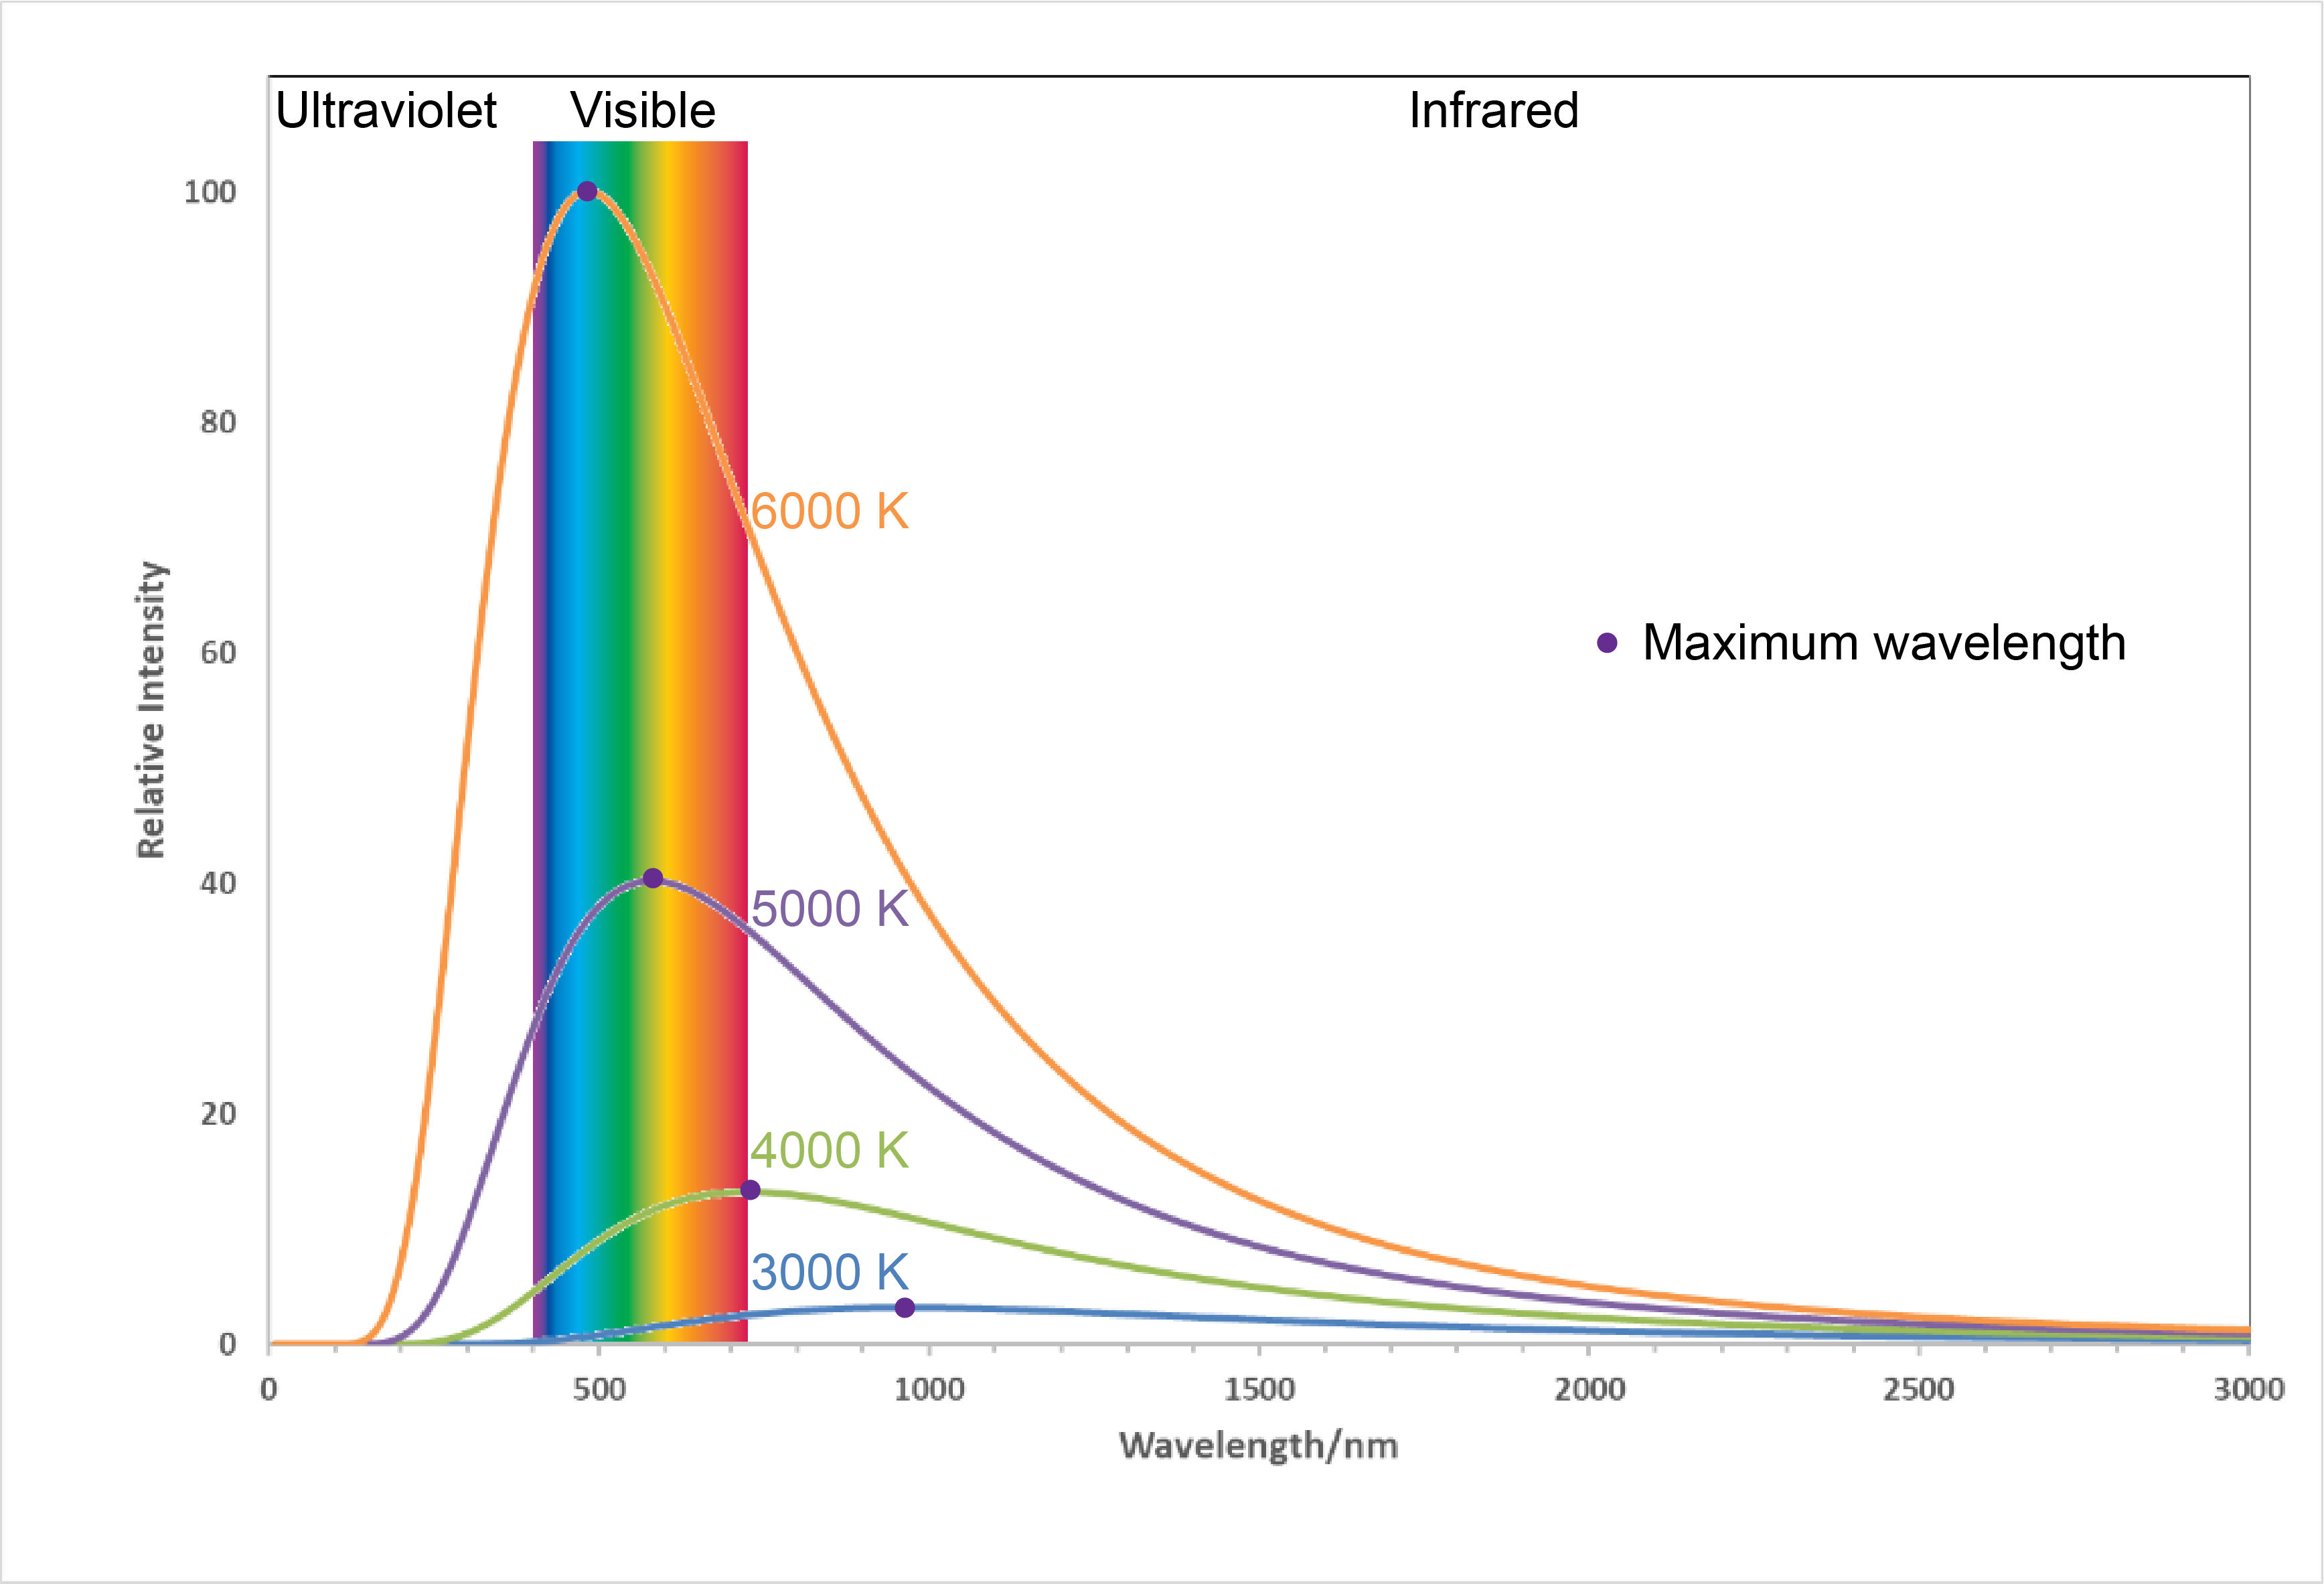
Figure 2 shows the spectra, graphs of intensity versus wavelength, for blackbody radiation emitted by matter at several different temperatures.

Here, each spectrum depends only on temperature. The wavelength corresponding to the maximum intensity in each curve, λmax, shifts to shorter wavelengths as the temperature increases. This corresponds to a heated metal first becoming red hot, then brighter and white hot as the temperature increases.
Activity 1: Interpreting Blackbody Spectra
Additional Practice 1
The temperatures listed in Figure 2 are often referred to as “color temperatures” because different temperatures make an object a different color. Use Figure 2 to predict the color of a blackbody at 4000 K and at 6000 K.

Additional Practice 2
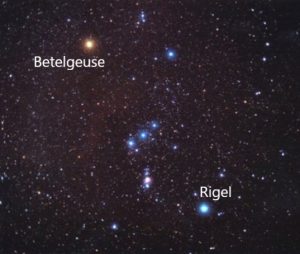
It is reasonable to assume that light from stars is blackbody radiation. This enables astronomers to determine the temperatures of stars based on their spectra. (Spectra enable astronomers to learn lots more about stars than just temperature!) In the constellation Orion, the hunter, the two brightest stars are Betelgeuse and Rigel. Based on the image shown on the right (modification of work by NASA c/o Matthew Spinelli), which star has higher surface temperature? (For an interesting three-minute video of a distant galaxy seen in X-ray, visible, and infrared spectra, follow this link.)
Planck’s Quantum Theory
In the late 1800s, physicists derived mathematical expressions for the blackbody curves using well-accepted concepts of mechanics and electromagnetism. They assumed that as the temperature increased the energies of atoms in a metal object would increase as the atoms vibrated more vigorously. These vibrations were assumed to create electromagnetic waves—the blackbody radiation. But no theory based on these ideas was able to predict the shapes of the curves shown in Figure 2. Even worse, the theory predicted that the intensity would become infinitely large for very short wavelengths, an absurd result.
In 1900, Max Planck introduced a revolutionary idea, from which he was able to derive a theoretical expression for blackbody spectra that fit the experimental observations within experimental error. Instead of assuming that the vibrating atoms could have a continuous set of energy values, Planck restricted the vibrational energies to discrete values—that is, he assumed that there must be some minimum quantity of energy that could be transferred between vibrating atoms. That quantity of energy is proportional to the frequency of vibration and is called a quantum.
The proportionality constant “h” is now known as Planck’s constant. Its value is very small, 6.626 × 10⁻³⁴ J·s (joule-seconds). According to Planck’s theory, electromagnetic radiation occurs in small, indivisible quantities (quanta), just as matter consists of small, chemically indivisible quantities (atoms).
The Photoelectric Effect
Activity 2: Preparation—Photoelectric Effect
Planck’s quantum theory was able to predict accurately the distribution of wavelengths emitted by a blackbody at various temperatures. However, Planck found it difficult to justify his assumption that vibration energies had to be multiples of a minimum energy—a quantum. When Albert Einstein used Planck’s quantum hypothesis to explain a different phenomenon, the photoelectric effect, the validity of quantum theory became clearer.
Exercise 2: Quanta and Laser Light (Review)
When electromagnetic radiation shines on a metal, such as sodium, electrons can be emitted and an electric current (a flow of electrons) can occur. This is called the photoelectric effect. The effect is complicated: for some wavelengths no electrons are emitted, but at other wavelengths electrons are emitted.
Activity 3: Photoelectric Effect Simulation
Watch the photoelectric effect animation video, where sodium is already selected, to answer the questions below. Write down your observations as you watch the animation, and then answer the questions in your course notebook.
- For which colors of visible light are electrons emitted by sodium? Determine the maximum wavelength at which electrons are emitted.
- At a wavelength where electrons are emitted, describe the shape of a graph of number of electrons emitted vs. light intensity.
- Determine the shape of a graph of electron energy vs. light frequency. How does this graph differ from the electrons vs. intensity graph?
- Based on your observations, draw a rough graph with labeled axes to show how the number of electrons emitted varies with wavelength of light. How would the graph change if the intensity of light increased?
If you would like to experiment with the simulation further, download and save the simulation program, go to the location where you saved it, and double-click on the file name (photoelectric_en.jar) to install and run it. You need to have Java installed for this to work.
Result
Solution
Additional Practice
- Assume that the intensity of light corresponds with the amplitude of light waves and try to explain the observations you made using the simulation.
- Above a maximum wavelength no electrons are emitted
- Electron current increases with light intensity
- Above a threshold frequency electron energy increases with frequency of light
- Assume that light comes in quanta and the energy of a quantum of light is hν (or
 ). Does this idea enable all three observations to be explained? Write an explanation in your own words.
 - Use this quantum assumption (number 2) to calculate the minimum energy required to cause an electron to be emitted from the surface of a sample of sodium.
- Suggest additional experiments you can do using the simulation to help confirm your response to question 2. Do those experiments and report the results.
Activity 4: Summary of Photoelectric Effect Results
In your course notebook, write a brief summary of the results you obtained from experimenting with the photoelectric effect simulation. Also write a summary of how your experimental results can be interpreted based on the idea that light consists of quanta. Compare what you wrote with the summary below [also available at this link] and, if necessary, revise what you wrote.
Exercise 3: Photoelectric Effect
Additional Practice
Activity 5: Wrap-up—Photoelectric Effect
Please use this form to report any inconsistencies, errors, or other things you would like to change about this page. We appreciate your comments. 🙂

